Immigrants from India vs Immigrants from Indonesia Associate's Degree
COMPARE
Immigrants from India
Immigrants from Indonesia
Associate's Degree
Associate's Degree Comparison
Immigrants from India
Immigrants from Indonesia
58.5%
ASSOCIATE'S DEGREE
100.0/ 100
METRIC RATING
3rd/ 347
METRIC RANK
51.0%
ASSOCIATE'S DEGREE
99.5/ 100
METRIC RATING
68th/ 347
METRIC RANK
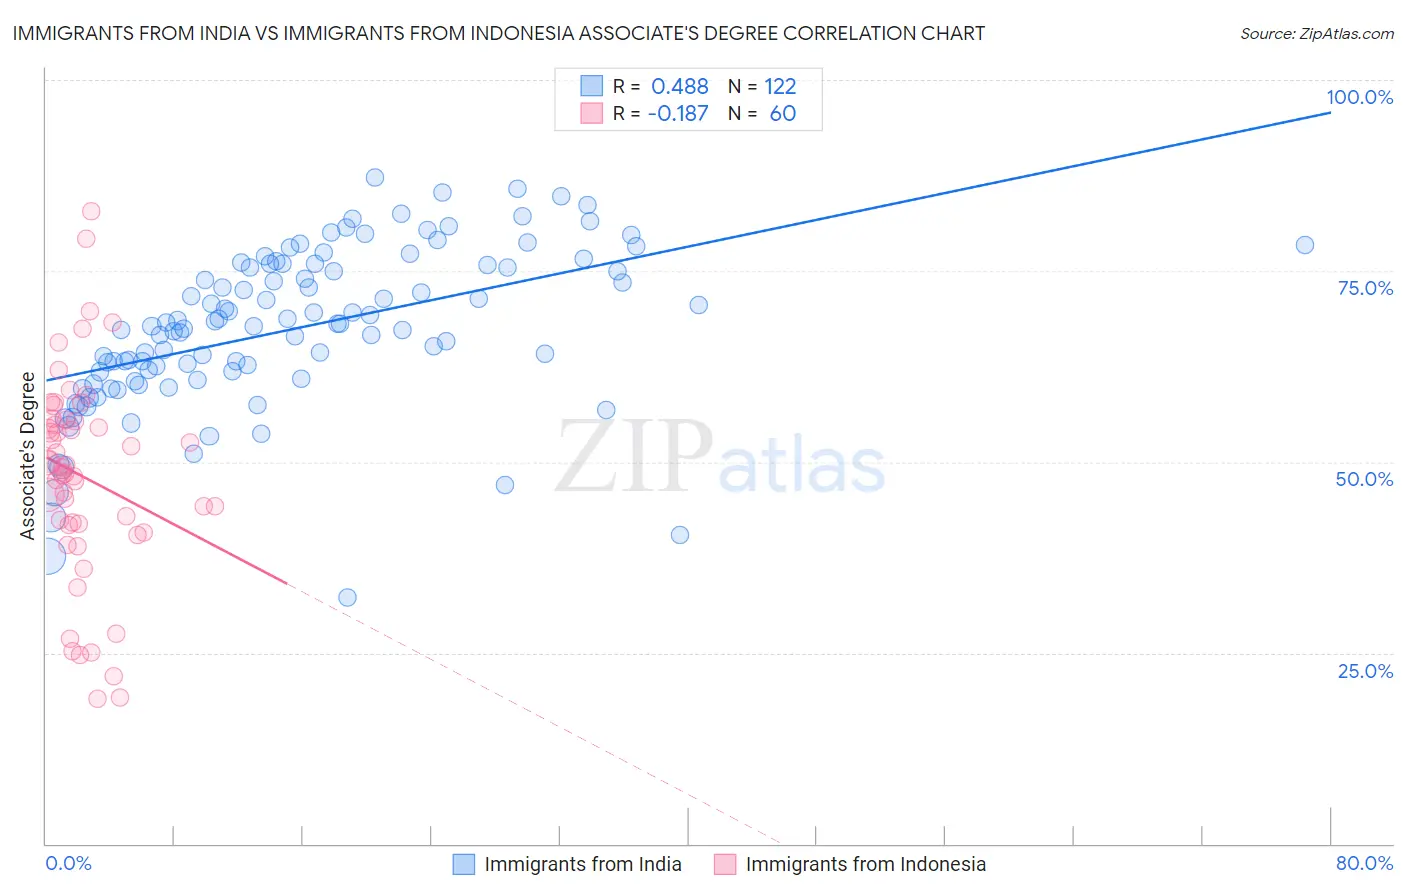
Immigrants from India vs Immigrants from Indonesia Associate's Degree Correlation Chart
The statistical analysis conducted on geographies consisting of 434,068,008 people shows a moderate positive correlation between the proportion of Immigrants from India and percentage of population with at least associate's degree education in the United States with a correlation coefficient (R) of 0.488 and weighted average of 58.5%. Similarly, the statistical analysis conducted on geographies consisting of 215,779,806 people shows a poor negative correlation between the proportion of Immigrants from Indonesia and percentage of population with at least associate's degree education in the United States with a correlation coefficient (R) of -0.187 and weighted average of 51.0%, a difference of 14.8%.
Associate's Degree Correlation Summary
| Measurement | Immigrants from India | Immigrants from Indonesia |
| Minimum | 32.2% | 19.0% |
| Maximum | 87.3% | 82.8% |
| Range | 55.1% | 63.7% |
| Mean | 67.4% | 48.1% |
| Median | 67.9% | 49.0% |
| Interquartile 25% (IQ1) | 60.9% | 41.9% |
| Interquartile 75% (IQ3) | 75.8% | 55.4% |
| Interquartile Range (IQR) | 14.8% | 13.5% |
| Standard Deviation (Sample) | 10.5% | 13.5% |
| Standard Deviation (Population) | 10.5% | 13.3% |
Similar Demographics by Associate's Degree
Demographics Similar to Immigrants from India by Associate's Degree
In terms of associate's degree, the demographic groups most similar to Immigrants from India are Immigrants from Taiwan (58.4%, a difference of 0.25%), Immigrants from Singapore (58.9%, a difference of 0.66%), Iranian (58.2%, a difference of 0.66%), Okinawan (57.7%, a difference of 1.5%), and Immigrants from Iran (57.7%, a difference of 1.5%).
| Demographics | Rating | Rank | Associate's Degree |
| Filipinos | 100.0 /100 | #1 | Exceptional 59.8% |
| Immigrants | Singapore | 100.0 /100 | #2 | Exceptional 58.9% |
| Immigrants | India | 100.0 /100 | #3 | Exceptional 58.5% |
| Immigrants | Taiwan | 100.0 /100 | #4 | Exceptional 58.4% |
| Iranians | 100.0 /100 | #5 | Exceptional 58.2% |
| Okinawans | 100.0 /100 | #6 | Exceptional 57.7% |
| Immigrants | Iran | 100.0 /100 | #7 | Exceptional 57.7% |
| Thais | 100.0 /100 | #8 | Exceptional 57.4% |
| Immigrants | Israel | 100.0 /100 | #9 | Exceptional 56.8% |
| Cypriots | 100.0 /100 | #10 | Exceptional 56.4% |
| Immigrants | Australia | 100.0 /100 | #11 | Exceptional 55.8% |
| Immigrants | South Central Asia | 100.0 /100 | #12 | Exceptional 55.7% |
| Immigrants | China | 100.0 /100 | #13 | Exceptional 55.5% |
| Immigrants | Hong Kong | 100.0 /100 | #14 | Exceptional 55.4% |
| Immigrants | Eastern Asia | 100.0 /100 | #15 | Exceptional 55.4% |
Demographics Similar to Immigrants from Indonesia by Associate's Degree
In terms of associate's degree, the demographic groups most similar to Immigrants from Indonesia are Egyptian (50.9%, a difference of 0.12%), Immigrants from Argentina (50.9%, a difference of 0.15%), Immigrants from Romania (50.9%, a difference of 0.16%), Immigrants from Pakistan (50.9%, a difference of 0.22%), and Argentinean (51.2%, a difference of 0.49%).
| Demographics | Rating | Rank | Associate's Degree |
| Immigrants | Kazakhstan | 99.7 /100 | #61 | Exceptional 51.4% |
| Bhutanese | 99.7 /100 | #62 | Exceptional 51.4% |
| South Africans | 99.7 /100 | #63 | Exceptional 51.4% |
| Immigrants | Netherlands | 99.7 /100 | #64 | Exceptional 51.4% |
| Zimbabweans | 99.7 /100 | #65 | Exceptional 51.3% |
| Immigrants | Europe | 99.7 /100 | #66 | Exceptional 51.3% |
| Argentineans | 99.6 /100 | #67 | Exceptional 51.2% |
| Immigrants | Indonesia | 99.5 /100 | #68 | Exceptional 51.0% |
| Egyptians | 99.5 /100 | #69 | Exceptional 50.9% |
| Immigrants | Argentina | 99.5 /100 | #70 | Exceptional 50.9% |
| Immigrants | Romania | 99.5 /100 | #71 | Exceptional 50.9% |
| Immigrants | Pakistan | 99.5 /100 | #72 | Exceptional 50.9% |
| Carpatho Rusyns | 99.3 /100 | #73 | Exceptional 50.6% |
| Lithuanians | 99.3 /100 | #74 | Exceptional 50.6% |
| Immigrants | Scotland | 99.3 /100 | #75 | Exceptional 50.6% |