Australian vs Native Hawaiian College, 1 year or more
COMPARE
Australian
Native Hawaiian
College, 1 year or more
College, 1 year or more Comparison
Australians
Native Hawaiians
64.6%
COLLEGE, 1 YEAR OR MORE
99.9/ 100
METRIC RATING
47th/ 347
METRIC RANK
57.6%
COLLEGE, 1 YEAR OR MORE
9.0/ 100
METRIC RATING
218th/ 347
METRIC RANK
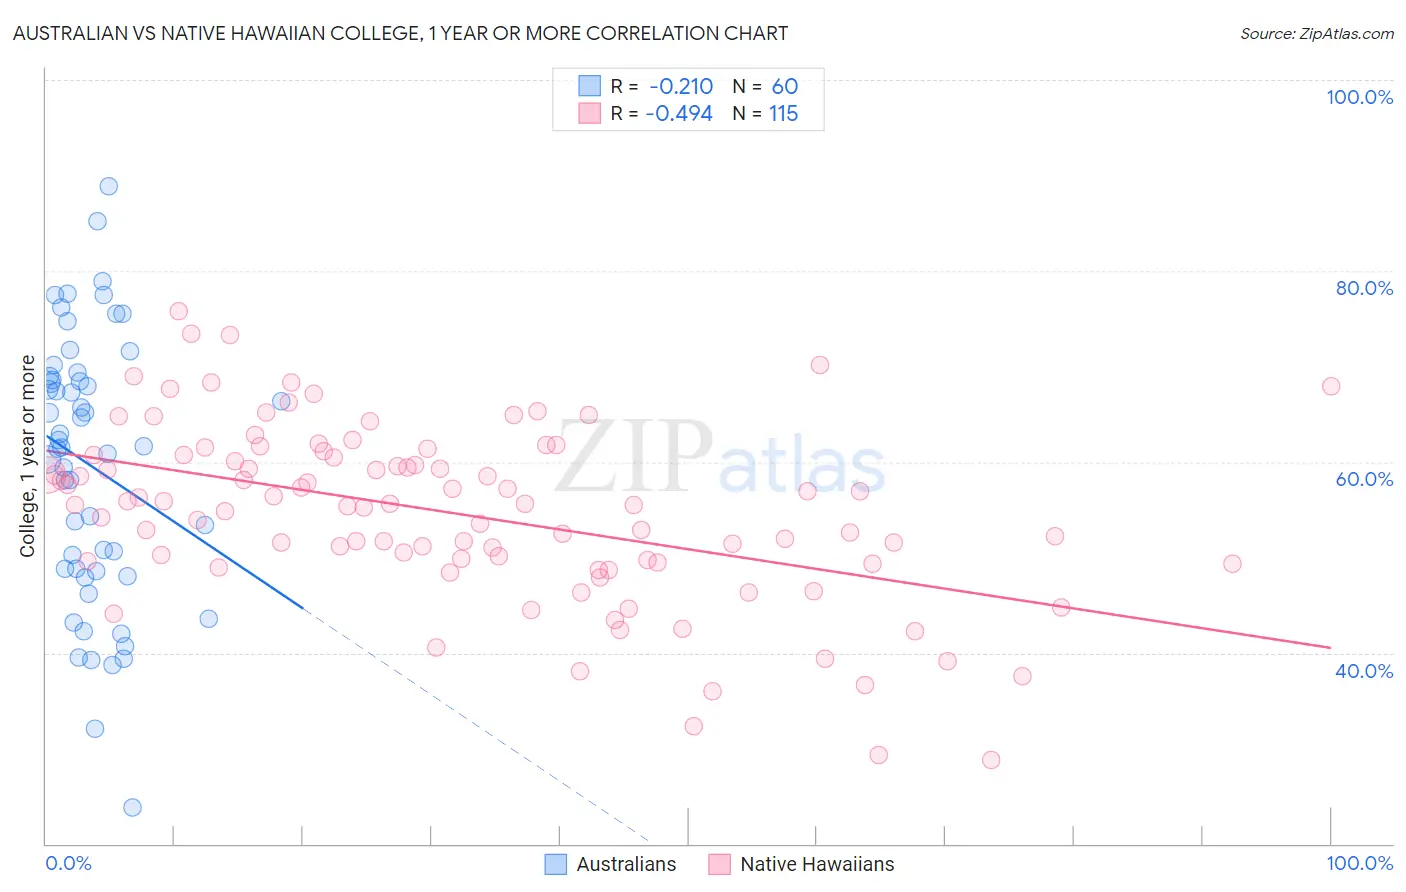
Australian vs Native Hawaiian College, 1 year or more Correlation Chart
The statistical analysis conducted on geographies consisting of 224,162,526 people shows a weak negative correlation between the proportion of Australians and percentage of population with at least college, 1 year or more education in the United States with a correlation coefficient (R) of -0.210 and weighted average of 64.6%. Similarly, the statistical analysis conducted on geographies consisting of 332,118,930 people shows a moderate negative correlation between the proportion of Native Hawaiians and percentage of population with at least college, 1 year or more education in the United States with a correlation coefficient (R) of -0.494 and weighted average of 57.6%, a difference of 12.2%.
College, 1 year or more Correlation Summary
| Measurement | Australian | Native Hawaiian |
| Minimum | 23.7% | 28.7% |
| Maximum | 88.8% | 75.7% |
| Range | 65.1% | 47.0% |
| Mean | 59.6% | 54.6% |
| Median | 61.6% | 55.5% |
| Interquartile 25% (IQ1) | 48.6% | 49.5% |
| Interquartile 75% (IQ3) | 68.8% | 60.7% |
| Interquartile Range (IQR) | 20.2% | 11.2% |
| Standard Deviation (Sample) | 14.0% | 9.2% |
| Standard Deviation (Population) | 13.8% | 9.2% |
Similar Demographics by College, 1 year or more
Demographics Similar to Australians by College, 1 year or more
In terms of college, 1 year or more, the demographic groups most similar to Australians are Bhutanese (64.6%, a difference of 0.010%), Immigrants from Lithuania (64.6%, a difference of 0.020%), Immigrants from Bulgaria (64.6%, a difference of 0.030%), New Zealander (64.6%, a difference of 0.070%), and Immigrants from Norway (64.7%, a difference of 0.18%).
| Demographics | Rating | Rank | College, 1 year or more |
| Immigrants | Kuwait | 99.9 /100 | #40 | Exceptional 65.0% |
| Mongolians | 99.9 /100 | #41 | Exceptional 64.8% |
| Immigrants | Latvia | 99.9 /100 | #42 | Exceptional 64.8% |
| Immigrants | Russia | 99.9 /100 | #43 | Exceptional 64.7% |
| Immigrants | Norway | 99.9 /100 | #44 | Exceptional 64.7% |
| Immigrants | Lithuania | 99.9 /100 | #45 | Exceptional 64.6% |
| Bhutanese | 99.9 /100 | #46 | Exceptional 64.6% |
| Australians | 99.9 /100 | #47 | Exceptional 64.6% |
| Immigrants | Bulgaria | 99.9 /100 | #48 | Exceptional 64.6% |
| New Zealanders | 99.9 /100 | #49 | Exceptional 64.6% |
| Immigrants | Austria | 99.8 /100 | #50 | Exceptional 64.4% |
| Immigrants | Malaysia | 99.8 /100 | #51 | Exceptional 64.3% |
| Immigrants | Netherlands | 99.8 /100 | #52 | Exceptional 64.2% |
| Asians | 99.8 /100 | #53 | Exceptional 64.2% |
| Zimbabweans | 99.8 /100 | #54 | Exceptional 64.2% |
Demographics Similar to Native Hawaiians by College, 1 year or more
In terms of college, 1 year or more, the demographic groups most similar to Native Hawaiians are Immigrants from Panama (57.6%, a difference of 0.0%), White/Caucasian (57.6%, a difference of 0.060%), Immigrants from Costa Rica (57.5%, a difference of 0.18%), Immigrants from Peru (57.7%, a difference of 0.24%), and Immigrants from Ghana (57.4%, a difference of 0.25%).
| Demographics | Rating | Rank | College, 1 year or more |
| Immigrants | Nigeria | 13.3 /100 | #211 | Poor 57.9% |
| Immigrants | Senegal | 11.8 /100 | #212 | Poor 57.8% |
| French Canadians | 11.8 /100 | #213 | Poor 57.8% |
| Immigrants | Colombia | 11.6 /100 | #214 | Poor 57.8% |
| Tongans | 11.6 /100 | #215 | Poor 57.8% |
| Immigrants | Peru | 10.6 /100 | #216 | Poor 57.7% |
| Immigrants | Panama | 9.1 /100 | #217 | Tragic 57.6% |
| Native Hawaiians | 9.0 /100 | #218 | Tragic 57.6% |
| Whites/Caucasians | 8.7 /100 | #219 | Tragic 57.6% |
| Immigrants | Costa Rica | 8.0 /100 | #220 | Tragic 57.5% |
| Immigrants | Ghana | 7.7 /100 | #221 | Tragic 57.4% |
| Sub-Saharan Africans | 6.1 /100 | #222 | Tragic 57.3% |
| Portuguese | 5.4 /100 | #223 | Tragic 57.2% |
| Hmong | 5.4 /100 | #224 | Tragic 57.2% |
| Vietnamese | 4.7 /100 | #225 | Tragic 57.0% |