Assyrian/Chaldean/Syriac vs Immigrants from Uganda 10th Grade
COMPARE
Assyrian/Chaldean/Syriac
Immigrants from Uganda
10th Grade
10th Grade Comparison
Assyrians/Chaldeans/Syriacs
Immigrants from Uganda
93.9%
10TH GRADE
69.7/ 100
METRIC RATING
161st/ 347
METRIC RANK
93.5%
10TH GRADE
20.9/ 100
METRIC RATING
202nd/ 347
METRIC RANK
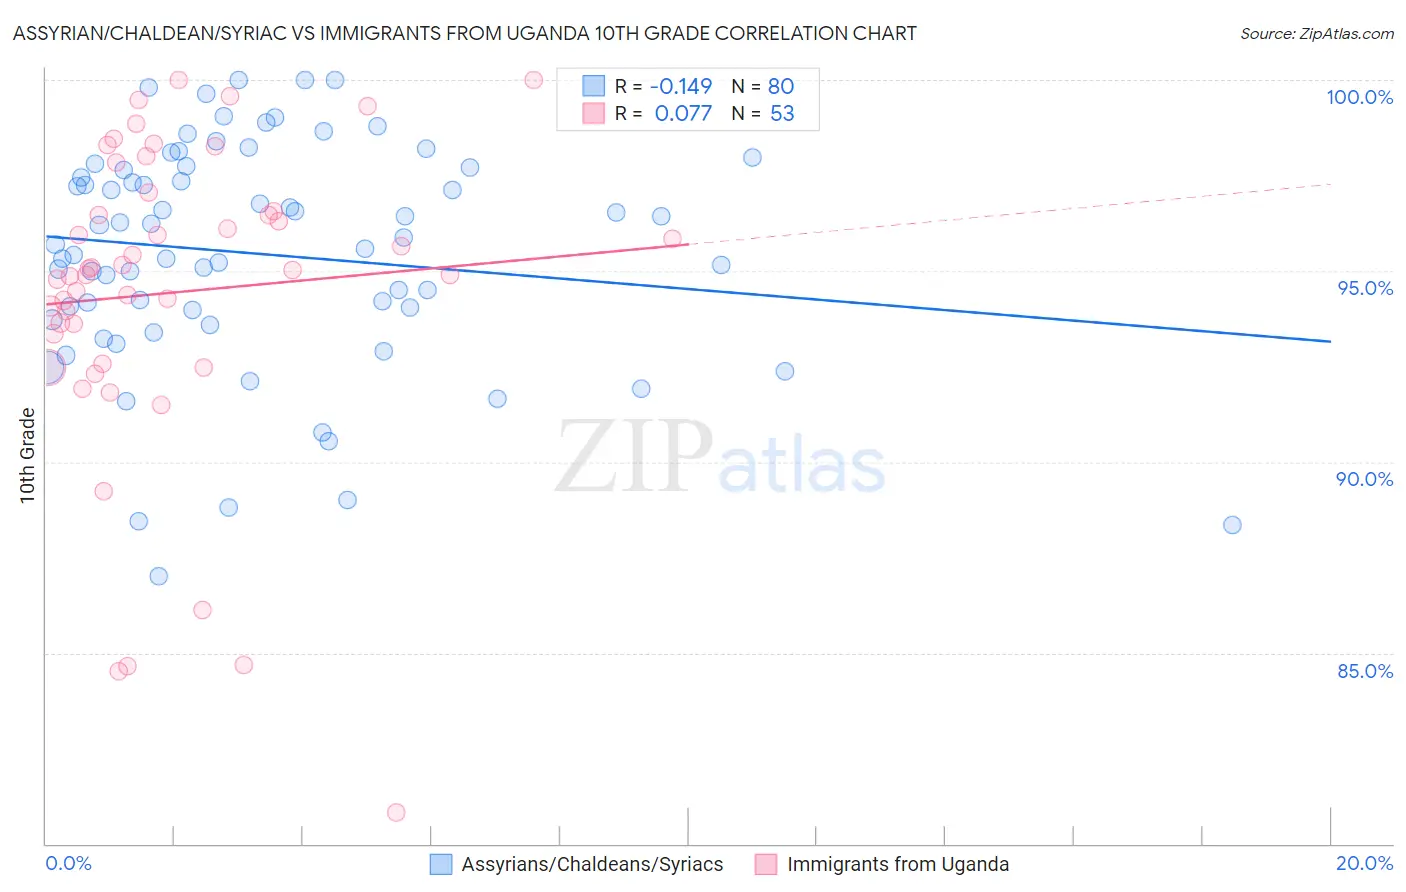
Assyrian/Chaldean/Syriac vs Immigrants from Uganda 10th Grade Correlation Chart
The statistical analysis conducted on geographies consisting of 110,318,125 people shows a poor negative correlation between the proportion of Assyrians/Chaldeans/Syriacs and percentage of population with at least 10th grade education in the United States with a correlation coefficient (R) of -0.149 and weighted average of 93.9%. Similarly, the statistical analysis conducted on geographies consisting of 125,970,180 people shows a slight positive correlation between the proportion of Immigrants from Uganda and percentage of population with at least 10th grade education in the United States with a correlation coefficient (R) of 0.077 and weighted average of 93.5%, a difference of 0.48%.
10th Grade Correlation Summary
| Measurement | Assyrian/Chaldean/Syriac | Immigrants from Uganda |
| Minimum | 87.0% | 80.8% |
| Maximum | 100.0% | 100.0% |
| Range | 13.0% | 19.2% |
| Mean | 95.4% | 94.4% |
| Median | 95.8% | 95.0% |
| Interquartile 25% (IQ1) | 93.9% | 93.0% |
| Interquartile 75% (IQ3) | 97.7% | 96.8% |
| Interquartile Range (IQR) | 3.8% | 3.8% |
| Standard Deviation (Sample) | 3.0% | 4.1% |
| Standard Deviation (Population) | 2.9% | 4.1% |
Similar Demographics by 10th Grade
Demographics Similar to Assyrians/Chaldeans/Syriacs by 10th Grade
In terms of 10th grade, the demographic groups most similar to Assyrians/Chaldeans/Syriacs are Pakistani (93.9%, a difference of 0.0%), Immigrants from Poland (93.9%, a difference of 0.0%), Venezuelan (93.9%, a difference of 0.0%), Bermudan (93.9%, a difference of 0.010%), and Chilean (93.9%, a difference of 0.010%).
| Demographics | Rating | Rank | 10th Grade |
| Immigrants | Kenya | 75.3 /100 | #154 | Good 94.0% |
| Spanish | 74.9 /100 | #155 | Good 94.0% |
| Mongolians | 74.4 /100 | #156 | Good 94.0% |
| Kiowa | 73.3 /100 | #157 | Good 93.9% |
| Bermudans | 71.0 /100 | #158 | Good 93.9% |
| Chileans | 70.2 /100 | #159 | Good 93.9% |
| Pakistanis | 70.1 /100 | #160 | Good 93.9% |
| Assyrians/Chaldeans/Syriacs | 69.7 /100 | #161 | Good 93.9% |
| Immigrants | Poland | 69.6 /100 | #162 | Good 93.9% |
| Venezuelans | 69.5 /100 | #163 | Good 93.9% |
| Iraqis | 68.1 /100 | #164 | Good 93.9% |
| Brazilians | 63.6 /100 | #165 | Good 93.8% |
| Immigrants | Iraq | 63.0 /100 | #166 | Good 93.8% |
| Immigrants | Egypt | 62.3 /100 | #167 | Good 93.8% |
| Alsatians | 59.4 /100 | #168 | Average 93.8% |
Demographics Similar to Immigrants from Uganda by 10th Grade
In terms of 10th grade, the demographic groups most similar to Immigrants from Uganda are Hawaiian (93.5%, a difference of 0.010%), Immigrants from Western Asia (93.4%, a difference of 0.010%), Ute (93.4%, a difference of 0.010%), Immigrants from Indonesia (93.4%, a difference of 0.010%), and Immigrants from Sudan (93.4%, a difference of 0.010%).
| Demographics | Rating | Rank | 10th Grade |
| Cheyenne | 26.8 /100 | #195 | Fair 93.5% |
| Moroccans | 25.3 /100 | #196 | Fair 93.5% |
| Pueblo | 23.9 /100 | #197 | Fair 93.5% |
| Immigrants | Micronesia | 23.2 /100 | #198 | Fair 93.5% |
| Asians | 23.0 /100 | #199 | Fair 93.5% |
| Hopi | 22.2 /100 | #200 | Fair 93.5% |
| Hawaiians | 21.8 /100 | #201 | Fair 93.5% |
| Immigrants | Uganda | 20.9 /100 | #202 | Fair 93.5% |
| Immigrants | Western Asia | 20.6 /100 | #203 | Fair 93.4% |
| Ute | 20.3 /100 | #204 | Fair 93.4% |
| Immigrants | Indonesia | 20.2 /100 | #205 | Fair 93.4% |
| Immigrants | Sudan | 20.0 /100 | #206 | Fair 93.4% |
| Samoans | 19.5 /100 | #207 | Poor 93.4% |
| Immigrants | Syria | 19.4 /100 | #208 | Poor 93.4% |
| Immigrants | Chile | 18.8 /100 | #209 | Poor 93.4% |