Senegalese vs Immigrants from Eastern Africa 12th Grade, No Diploma
COMPARE
Senegalese
Immigrants from Eastern Africa
12th Grade, No Diploma
12th Grade, No Diploma Comparison
Senegalese
Immigrants from Eastern Africa
89.9%
12TH GRADE, NO DIPLOMA
1.1/ 100
METRIC RATING
249th/ 347
METRIC RANK
90.9%
12TH GRADE, NO DIPLOMA
27.7/ 100
METRIC RATING
192nd/ 347
METRIC RANK
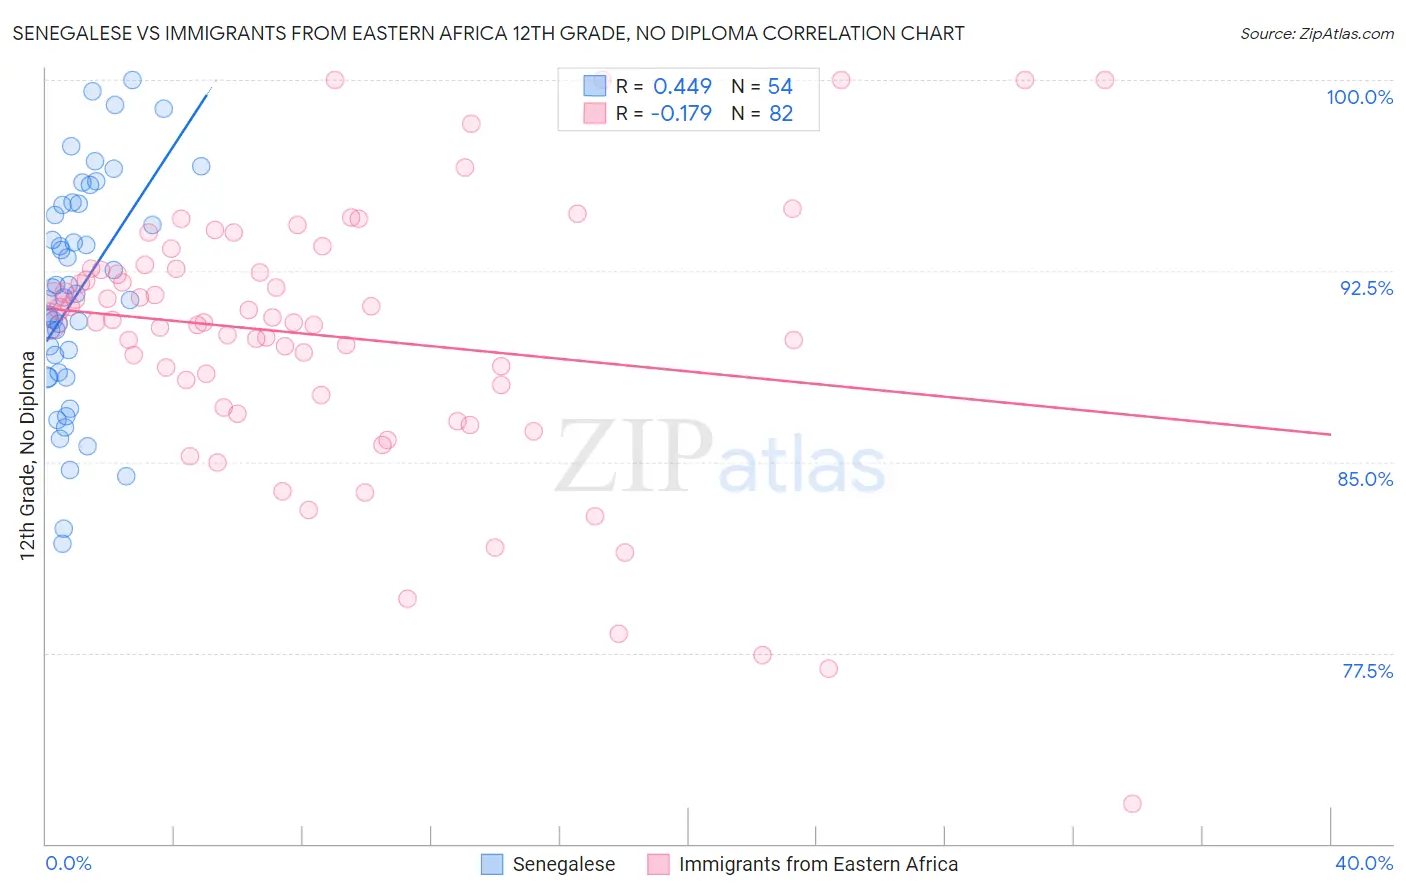
Senegalese vs Immigrants from Eastern Africa 12th Grade, No Diploma Correlation Chart
The statistical analysis conducted on geographies consisting of 78,142,569 people shows a moderate positive correlation between the proportion of Senegalese and percentage of population with at least 12th grade (no diploma) education in the United States with a correlation coefficient (R) of 0.449 and weighted average of 89.9%. Similarly, the statistical analysis conducted on geographies consisting of 355,153,076 people shows a poor negative correlation between the proportion of Immigrants from Eastern Africa and percentage of population with at least 12th grade (no diploma) education in the United States with a correlation coefficient (R) of -0.179 and weighted average of 90.9%, a difference of 1.1%.
12th Grade, No Diploma Correlation Summary
| Measurement | Senegalese | Immigrants from Eastern Africa |
| Minimum | 81.8% | 71.6% |
| Maximum | 100.0% | 100.0% |
| Range | 18.2% | 28.4% |
| Mean | 91.6% | 89.9% |
| Median | 91.5% | 90.5% |
| Interquartile 25% (IQ1) | 88.5% | 87.6% |
| Interquartile 75% (IQ3) | 95.1% | 92.6% |
| Interquartile Range (IQR) | 6.6% | 4.9% |
| Standard Deviation (Sample) | 4.3% | 5.3% |
| Standard Deviation (Population) | 4.3% | 5.3% |
Similar Demographics by 12th Grade, No Diploma
Demographics Similar to Senegalese by 12th Grade, No Diploma
In terms of 12th grade, no diploma, the demographic groups most similar to Senegalese are Comanche (89.9%, a difference of 0.0%), Immigrants from Eritrea (89.9%, a difference of 0.030%), Spanish American (89.9%, a difference of 0.040%), Bahamian (89.9%, a difference of 0.050%), and Immigrants from Nigeria (89.9%, a difference of 0.060%).
| Demographics | Rating | Rank | 12th Grade, No Diploma |
| Immigrants | Costa Rica | 1.6 /100 | #242 | Tragic 90.0% |
| Crow | 1.5 /100 | #243 | Tragic 90.0% |
| Taiwanese | 1.5 /100 | #244 | Tragic 90.0% |
| Immigrants | Uruguay | 1.4 /100 | #245 | Tragic 90.0% |
| Ghanaians | 1.3 /100 | #246 | Tragic 90.0% |
| Immigrants | Nigeria | 1.3 /100 | #247 | Tragic 89.9% |
| Comanche | 1.1 /100 | #248 | Tragic 89.9% |
| Senegalese | 1.1 /100 | #249 | Tragic 89.9% |
| Immigrants | Eritrea | 1.0 /100 | #250 | Tragic 89.9% |
| Spanish Americans | 0.9 /100 | #251 | Tragic 89.9% |
| Bahamians | 0.9 /100 | #252 | Tragic 89.9% |
| Choctaw | 0.7 /100 | #253 | Tragic 89.8% |
| Immigrants | Peru | 0.5 /100 | #254 | Tragic 89.7% |
| Immigrants | Senegal | 0.5 /100 | #255 | Tragic 89.7% |
| Immigrants | Ghana | 0.5 /100 | #256 | Tragic 89.7% |
Demographics Similar to Immigrants from Eastern Africa by 12th Grade, No Diploma
In terms of 12th grade, no diploma, the demographic groups most similar to Immigrants from Eastern Africa are Immigrants from Ethiopia (90.9%, a difference of 0.010%), Moroccan (90.9%, a difference of 0.020%), Afghan (90.9%, a difference of 0.030%), Immigrants from Oceania (90.9%, a difference of 0.030%), and Korean (90.8%, a difference of 0.050%).
| Demographics | Rating | Rank | 12th Grade, No Diploma |
| Sudanese | 34.4 /100 | #185 | Fair 91.0% |
| Ethiopians | 33.9 /100 | #186 | Fair 91.0% |
| Potawatomi | 32.9 /100 | #187 | Fair 91.0% |
| Americans | 32.6 /100 | #188 | Fair 91.0% |
| Immigrants | Uganda | 31.6 /100 | #189 | Fair 90.9% |
| Afghans | 29.9 /100 | #190 | Fair 90.9% |
| Moroccans | 28.8 /100 | #191 | Fair 90.9% |
| Immigrants | Eastern Africa | 27.7 /100 | #192 | Fair 90.9% |
| Immigrants | Ethiopia | 27.2 /100 | #193 | Fair 90.9% |
| Immigrants | Oceania | 26.0 /100 | #194 | Fair 90.9% |
| Koreans | 24.5 /100 | #195 | Fair 90.8% |
| Panamanians | 22.8 /100 | #196 | Fair 90.8% |
| Immigrants | Sudan | 22.6 /100 | #197 | Fair 90.8% |
| Samoans | 20.4 /100 | #198 | Fair 90.8% |
| Immigrants | Southern Europe | 19.9 /100 | #199 | Poor 90.8% |