Cape Verdean vs Immigrants from Eastern Africa 12th Grade, No Diploma
COMPARE
Cape Verdean
Immigrants from Eastern Africa
12th Grade, No Diploma
12th Grade, No Diploma Comparison
Cape Verdeans
Immigrants from Eastern Africa
87.4%
12TH GRADE, NO DIPLOMA
0.0/ 100
METRIC RATING
314th/ 347
METRIC RANK
90.9%
12TH GRADE, NO DIPLOMA
27.7/ 100
METRIC RATING
192nd/ 347
METRIC RANK
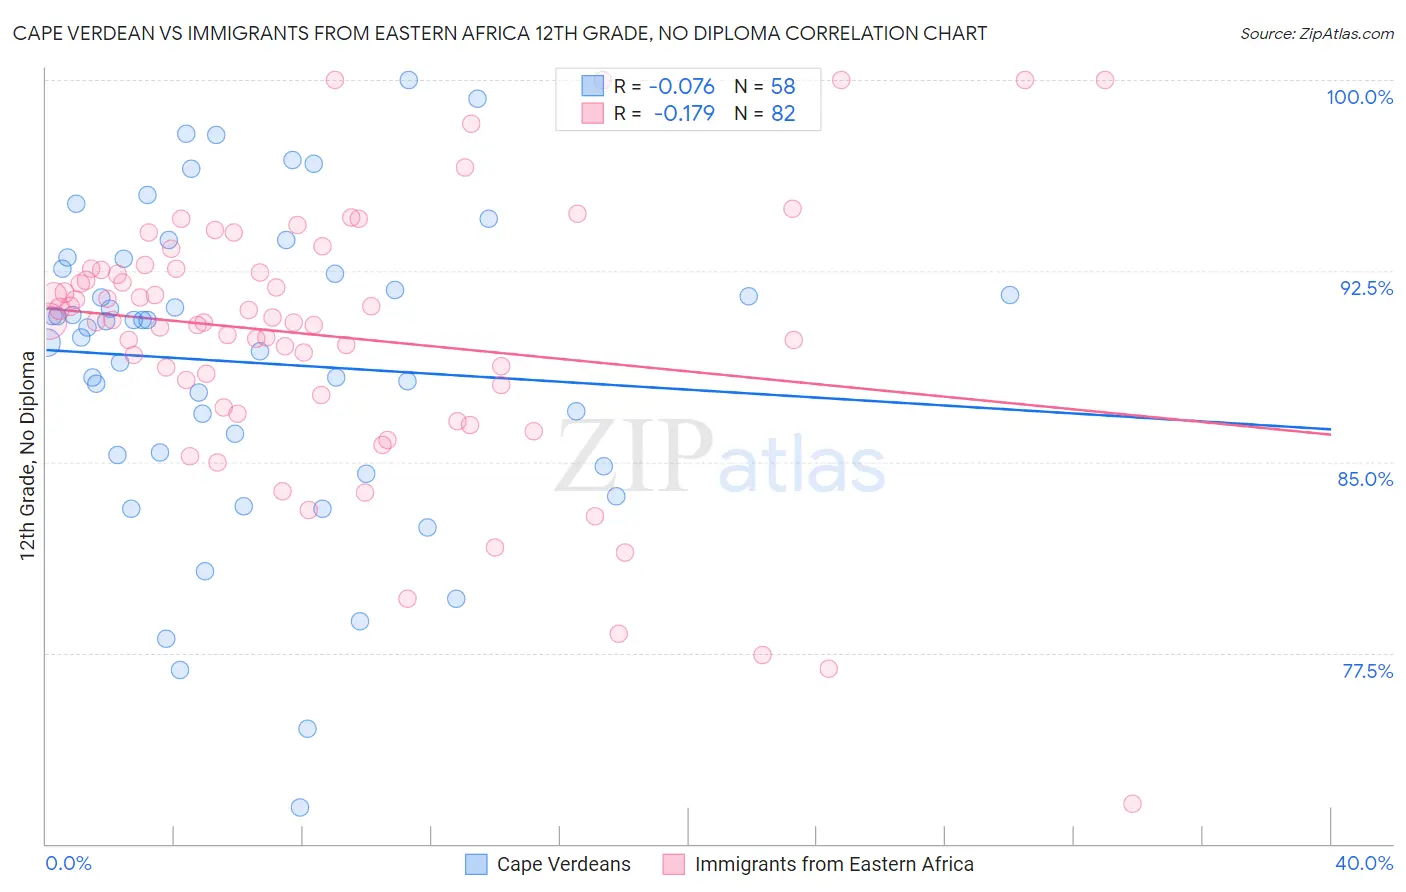
Cape Verdean vs Immigrants from Eastern Africa 12th Grade, No Diploma Correlation Chart
The statistical analysis conducted on geographies consisting of 107,537,955 people shows a slight negative correlation between the proportion of Cape Verdeans and percentage of population with at least 12th grade (no diploma) education in the United States with a correlation coefficient (R) of -0.076 and weighted average of 87.4%. Similarly, the statistical analysis conducted on geographies consisting of 355,153,076 people shows a poor negative correlation between the proportion of Immigrants from Eastern Africa and percentage of population with at least 12th grade (no diploma) education in the United States with a correlation coefficient (R) of -0.179 and weighted average of 90.9%, a difference of 4.0%.
12th Grade, No Diploma Correlation Summary
| Measurement | Cape Verdean | Immigrants from Eastern Africa |
| Minimum | 71.4% | 71.6% |
| Maximum | 100.0% | 100.0% |
| Range | 28.6% | 28.4% |
| Mean | 88.9% | 89.9% |
| Median | 90.4% | 90.5% |
| Interquartile 25% (IQ1) | 85.3% | 87.6% |
| Interquartile 75% (IQ3) | 92.6% | 92.6% |
| Interquartile Range (IQR) | 7.3% | 4.9% |
| Standard Deviation (Sample) | 6.1% | 5.3% |
| Standard Deviation (Population) | 6.1% | 5.3% |
Similar Demographics by 12th Grade, No Diploma
Demographics Similar to Cape Verdeans by 12th Grade, No Diploma
In terms of 12th grade, no diploma, the demographic groups most similar to Cape Verdeans are Immigrants from Caribbean (87.4%, a difference of 0.020%), Nicaraguan (87.3%, a difference of 0.040%), Apache (87.3%, a difference of 0.050%), Immigrants from Ecuador (87.5%, a difference of 0.13%), and Yaqui (87.5%, a difference of 0.14%).
| Demographics | Rating | Rank | 12th Grade, No Diploma |
| Immigrants | Portugal | 0.0 /100 | #307 | Tragic 87.6% |
| Yup'ik | 0.0 /100 | #308 | Tragic 87.6% |
| Immigrants | Armenia | 0.0 /100 | #309 | Tragic 87.6% |
| Immigrants | Cuba | 0.0 /100 | #310 | Tragic 87.5% |
| Yaqui | 0.0 /100 | #311 | Tragic 87.5% |
| Immigrants | Ecuador | 0.0 /100 | #312 | Tragic 87.5% |
| Immigrants | Caribbean | 0.0 /100 | #313 | Tragic 87.4% |
| Cape Verdeans | 0.0 /100 | #314 | Tragic 87.4% |
| Nicaraguans | 0.0 /100 | #315 | Tragic 87.3% |
| Apache | 0.0 /100 | #316 | Tragic 87.3% |
| Navajo | 0.0 /100 | #317 | Tragic 87.1% |
| Belizeans | 0.0 /100 | #318 | Tragic 87.0% |
| Immigrants | Belize | 0.0 /100 | #319 | Tragic 87.0% |
| Immigrants | Nicaragua | 0.0 /100 | #320 | Tragic 86.6% |
| Puerto Ricans | 0.0 /100 | #321 | Tragic 86.5% |
Demographics Similar to Immigrants from Eastern Africa by 12th Grade, No Diploma
In terms of 12th grade, no diploma, the demographic groups most similar to Immigrants from Eastern Africa are Immigrants from Ethiopia (90.9%, a difference of 0.010%), Moroccan (90.9%, a difference of 0.020%), Afghan (90.9%, a difference of 0.030%), Immigrants from Oceania (90.9%, a difference of 0.030%), and Korean (90.8%, a difference of 0.050%).
| Demographics | Rating | Rank | 12th Grade, No Diploma |
| Sudanese | 34.4 /100 | #185 | Fair 91.0% |
| Ethiopians | 33.9 /100 | #186 | Fair 91.0% |
| Potawatomi | 32.9 /100 | #187 | Fair 91.0% |
| Americans | 32.6 /100 | #188 | Fair 91.0% |
| Immigrants | Uganda | 31.6 /100 | #189 | Fair 90.9% |
| Afghans | 29.9 /100 | #190 | Fair 90.9% |
| Moroccans | 28.8 /100 | #191 | Fair 90.9% |
| Immigrants | Eastern Africa | 27.7 /100 | #192 | Fair 90.9% |
| Immigrants | Ethiopia | 27.2 /100 | #193 | Fair 90.9% |
| Immigrants | Oceania | 26.0 /100 | #194 | Fair 90.9% |
| Koreans | 24.5 /100 | #195 | Fair 90.8% |
| Panamanians | 22.8 /100 | #196 | Fair 90.8% |
| Immigrants | Sudan | 22.6 /100 | #197 | Fair 90.8% |
| Samoans | 20.4 /100 | #198 | Fair 90.8% |
| Immigrants | Southern Europe | 19.9 /100 | #199 | Poor 90.8% |