Assyrian/Chaldean/Syriac vs French American Indian Professional Degree
COMPARE
Assyrian/Chaldean/Syriac
French American Indian
Professional Degree
Professional Degree Comparison
Assyrians/Chaldeans/Syriacs
French American Indians
4.5%
PROFESSIONAL DEGREE
67.4/ 100
METRIC RATING
161st/ 347
METRIC RANK
3.8%
PROFESSIONAL DEGREE
1.7/ 100
METRIC RATING
245th/ 347
METRIC RANK
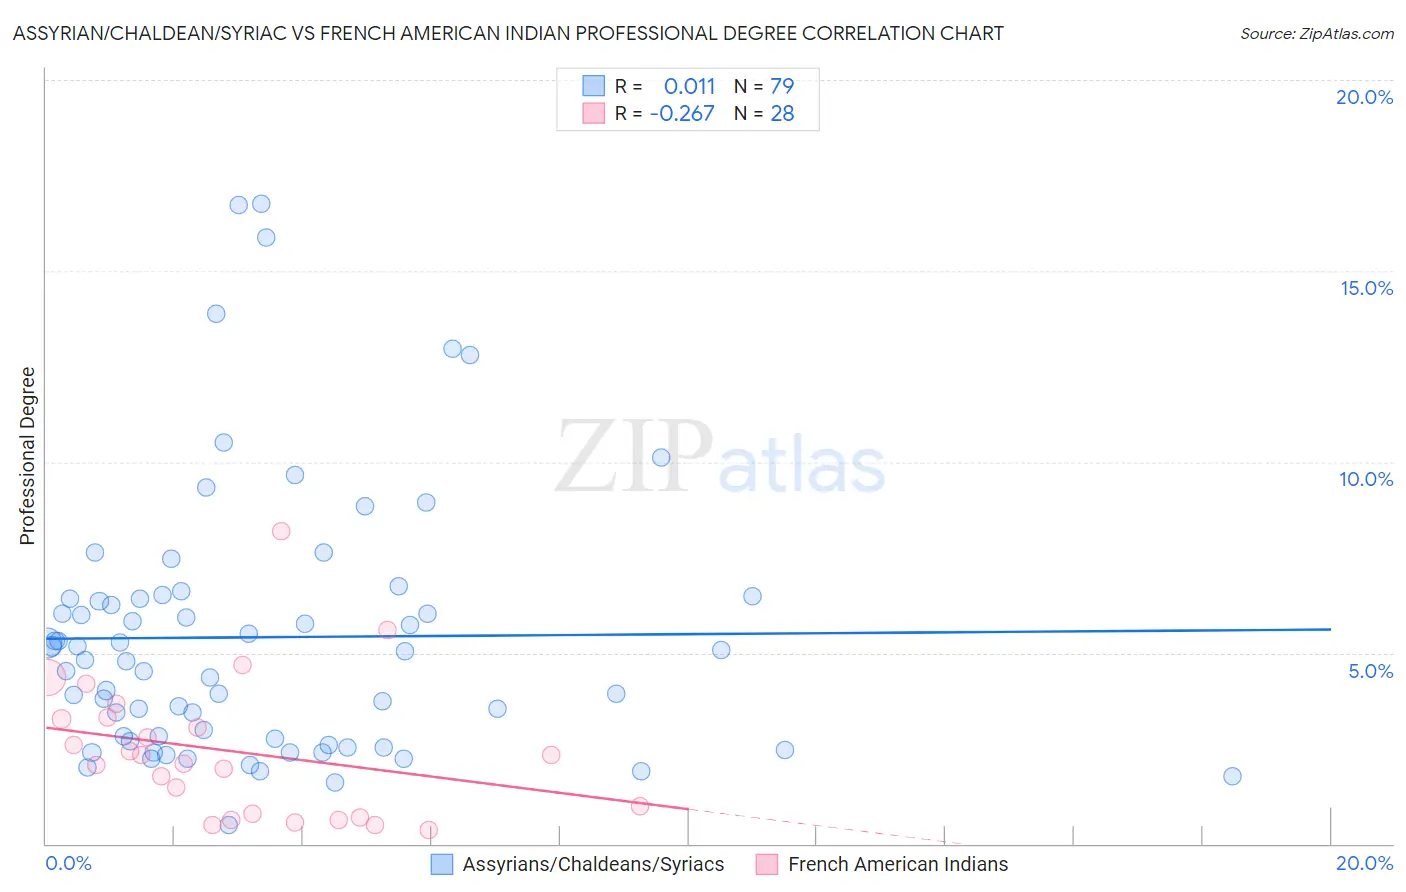
Assyrian/Chaldean/Syriac vs French American Indian Professional Degree Correlation Chart
The statistical analysis conducted on geographies consisting of 110,257,052 people shows no correlation between the proportion of Assyrians/Chaldeans/Syriacs and percentage of population with at least professional degree education in the United States with a correlation coefficient (R) of 0.011 and weighted average of 4.5%. Similarly, the statistical analysis conducted on geographies consisting of 131,791,322 people shows a weak negative correlation between the proportion of French American Indians and percentage of population with at least professional degree education in the United States with a correlation coefficient (R) of -0.267 and weighted average of 3.8%, a difference of 20.3%.
Professional Degree Correlation Summary
| Measurement | Assyrian/Chaldean/Syriac | French American Indian |
| Minimum | 0.50% | 0.35% |
| Maximum | 16.8% | 8.2% |
| Range | 16.3% | 7.8% |
| Mean | 5.4% | 2.4% |
| Median | 4.8% | 2.2% |
| Interquartile 25% (IQ1) | 2.7% | 0.74% |
| Interquartile 75% (IQ3) | 6.4% | 3.3% |
| Interquartile Range (IQR) | 3.7% | 2.5% |
| Standard Deviation (Sample) | 3.5% | 1.8% |
| Standard Deviation (Population) | 3.5% | 1.8% |
Similar Demographics by Professional Degree
Demographics Similar to Assyrians/Chaldeans/Syriacs by Professional Degree
In terms of professional degree, the demographic groups most similar to Assyrians/Chaldeans/Syriacs are Immigrants from Senegal (4.5%, a difference of 0.10%), Vietnamese (4.5%, a difference of 0.16%), Immigrants from Armenia (4.5%, a difference of 0.24%), Peruvian (4.5%, a difference of 0.34%), and Iraqi (4.5%, a difference of 0.41%).
| Demographics | Rating | Rank | Professional Degree |
| Scottish | 71.8 /100 | #154 | Good 4.6% |
| Slavs | 70.8 /100 | #155 | Good 4.5% |
| Swedes | 69.9 /100 | #156 | Good 4.5% |
| Iraqis | 69.8 /100 | #157 | Good 4.5% |
| Immigrants | Armenia | 68.8 /100 | #158 | Good 4.5% |
| Vietnamese | 68.4 /100 | #159 | Good 4.5% |
| Immigrants | Senegal | 68.0 /100 | #160 | Good 4.5% |
| Assyrians/Chaldeans/Syriacs | 67.4 /100 | #161 | Good 4.5% |
| Peruvians | 65.2 /100 | #162 | Good 4.5% |
| Sierra Leoneans | 64.3 /100 | #163 | Good 4.5% |
| Swiss | 61.0 /100 | #164 | Good 4.5% |
| Costa Ricans | 59.9 /100 | #165 | Average 4.5% |
| Immigrants | Colombia | 59.4 /100 | #166 | Average 4.5% |
| Immigrants | Afghanistan | 59.2 /100 | #167 | Average 4.5% |
| Immigrants | Sierra Leone | 58.7 /100 | #168 | Average 4.5% |
Demographics Similar to French American Indians by Professional Degree
In terms of professional degree, the demographic groups most similar to French American Indians are Marshallese (3.8%, a difference of 0.17%), Guyanese (3.8%, a difference of 0.20%), Hmong (3.7%, a difference of 0.36%), Immigrants from Grenada (3.7%, a difference of 0.47%), and Immigrants from Fiji (3.7%, a difference of 0.53%).
| Demographics | Rating | Rank | Professional Degree |
| Colville | 2.6 /100 | #238 | Tragic 3.8% |
| British West Indians | 2.4 /100 | #239 | Tragic 3.8% |
| Immigrants | Ecuador | 2.3 /100 | #240 | Tragic 3.8% |
| Alaskan Athabascans | 2.3 /100 | #241 | Tragic 3.8% |
| Native Hawaiians | 2.3 /100 | #242 | Tragic 3.8% |
| Guamanians/Chamorros | 2.2 /100 | #243 | Tragic 3.8% |
| Immigrants | Bahamas | 2.0 /100 | #244 | Tragic 3.8% |
| French American Indians | 1.7 /100 | #245 | Tragic 3.8% |
| Marshallese | 1.7 /100 | #246 | Tragic 3.8% |
| Guyanese | 1.6 /100 | #247 | Tragic 3.8% |
| Hmong | 1.6 /100 | #248 | Tragic 3.7% |
| Immigrants | Grenada | 1.5 /100 | #249 | Tragic 3.7% |
| Immigrants | Fiji | 1.5 /100 | #250 | Tragic 3.7% |
| Immigrants | Nicaragua | 1.4 /100 | #251 | Tragic 3.7% |
| Jamaicans | 1.4 /100 | #252 | Tragic 3.7% |