Assyrian/Chaldean/Syriac vs Scandinavian Professional Degree
COMPARE
Assyrian/Chaldean/Syriac
Scandinavian
Professional Degree
Professional Degree Comparison
Assyrians/Chaldeans/Syriacs
Scandinavians
4.5%
PROFESSIONAL DEGREE
67.4/ 100
METRIC RATING
161st/ 347
METRIC RANK
4.2%
PROFESSIONAL DEGREE
25.8/ 100
METRIC RATING
194th/ 347
METRIC RANK
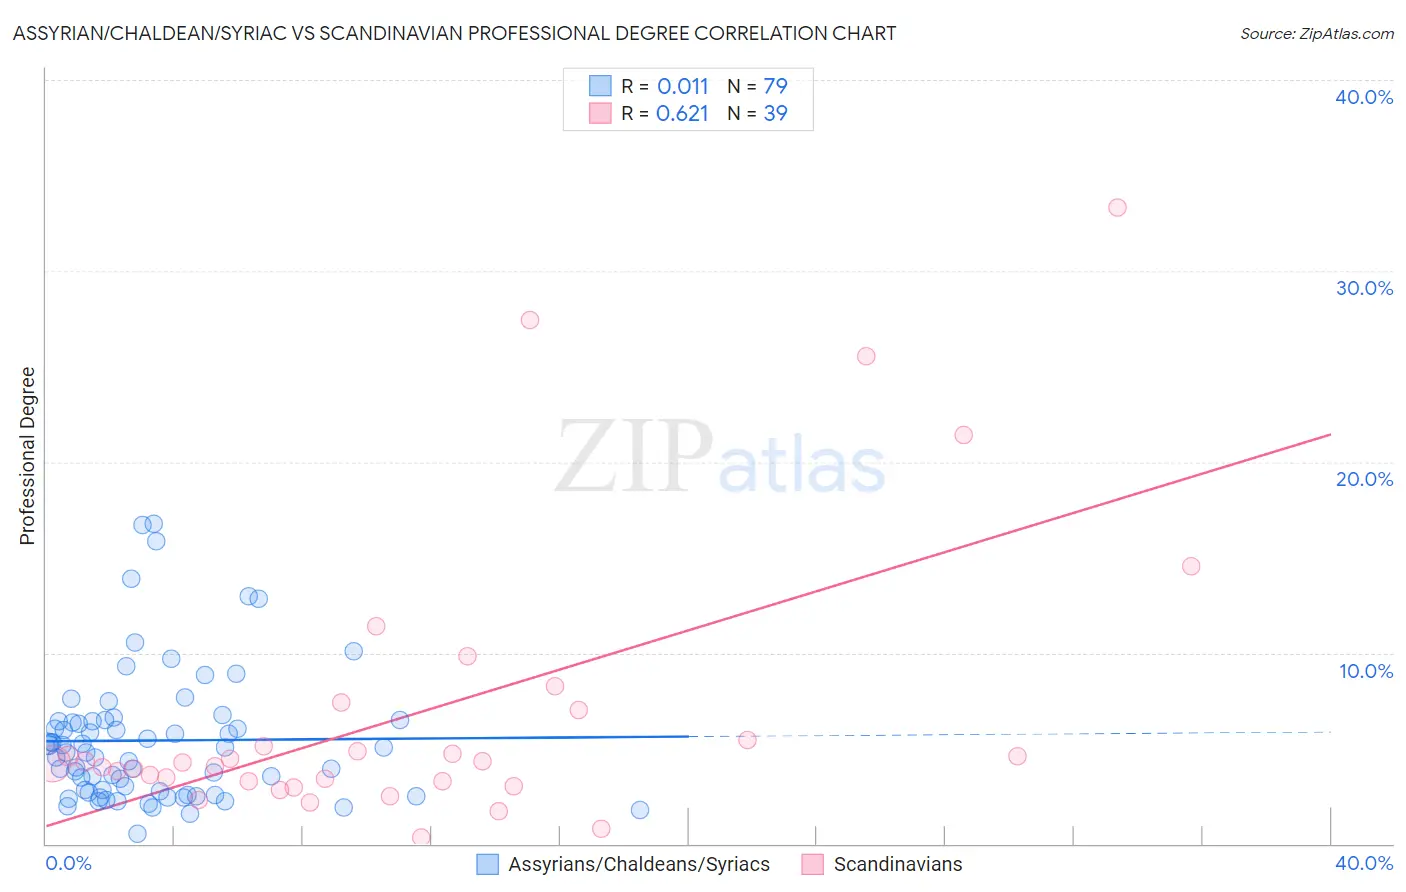
Assyrian/Chaldean/Syriac vs Scandinavian Professional Degree Correlation Chart
The statistical analysis conducted on geographies consisting of 110,257,052 people shows no correlation between the proportion of Assyrians/Chaldeans/Syriacs and percentage of population with at least professional degree education in the United States with a correlation coefficient (R) of 0.011 and weighted average of 4.5%. Similarly, the statistical analysis conducted on geographies consisting of 469,840,840 people shows a significant positive correlation between the proportion of Scandinavians and percentage of population with at least professional degree education in the United States with a correlation coefficient (R) of 0.621 and weighted average of 4.2%, a difference of 6.7%.
Professional Degree Correlation Summary
| Measurement | Assyrian/Chaldean/Syriac | Scandinavian |
| Minimum | 0.50% | 0.33% |
| Maximum | 16.8% | 33.3% |
| Range | 16.3% | 33.0% |
| Mean | 5.4% | 6.9% |
| Median | 4.8% | 4.2% |
| Interquartile 25% (IQ1) | 2.7% | 3.3% |
| Interquartile 75% (IQ3) | 6.4% | 7.0% |
| Interquartile Range (IQR) | 3.7% | 3.8% |
| Standard Deviation (Sample) | 3.5% | 7.5% |
| Standard Deviation (Population) | 3.5% | 7.4% |
Similar Demographics by Professional Degree
Demographics Similar to Assyrians/Chaldeans/Syriacs by Professional Degree
In terms of professional degree, the demographic groups most similar to Assyrians/Chaldeans/Syriacs are Immigrants from Senegal (4.5%, a difference of 0.10%), Vietnamese (4.5%, a difference of 0.16%), Immigrants from Armenia (4.5%, a difference of 0.24%), Peruvian (4.5%, a difference of 0.34%), and Iraqi (4.5%, a difference of 0.41%).
| Demographics | Rating | Rank | Professional Degree |
| Scottish | 71.8 /100 | #154 | Good 4.6% |
| Slavs | 70.8 /100 | #155 | Good 4.5% |
| Swedes | 69.9 /100 | #156 | Good 4.5% |
| Iraqis | 69.8 /100 | #157 | Good 4.5% |
| Immigrants | Armenia | 68.8 /100 | #158 | Good 4.5% |
| Vietnamese | 68.4 /100 | #159 | Good 4.5% |
| Immigrants | Senegal | 68.0 /100 | #160 | Good 4.5% |
| Assyrians/Chaldeans/Syriacs | 67.4 /100 | #161 | Good 4.5% |
| Peruvians | 65.2 /100 | #162 | Good 4.5% |
| Sierra Leoneans | 64.3 /100 | #163 | Good 4.5% |
| Swiss | 61.0 /100 | #164 | Good 4.5% |
| Costa Ricans | 59.9 /100 | #165 | Average 4.5% |
| Immigrants | Colombia | 59.4 /100 | #166 | Average 4.5% |
| Immigrants | Afghanistan | 59.2 /100 | #167 | Average 4.5% |
| Immigrants | Sierra Leone | 58.7 /100 | #168 | Average 4.5% |
Demographics Similar to Scandinavians by Professional Degree
In terms of professional degree, the demographic groups most similar to Scandinavians are Nigerian (4.2%, a difference of 0.24%), French (4.2%, a difference of 0.25%), Ghanaian (4.3%, a difference of 0.29%), Spanish (4.2%, a difference of 0.57%), and Sri Lankan (4.3%, a difference of 0.62%).
| Demographics | Rating | Rank | Professional Degree |
| Immigrants | Cameroon | 33.3 /100 | #187 | Fair 4.3% |
| Immigrants | Thailand | 31.7 /100 | #188 | Fair 4.3% |
| Slovaks | 30.7 /100 | #189 | Fair 4.3% |
| Immigrants | Poland | 29.2 /100 | #190 | Fair 4.3% |
| Sri Lankans | 29.0 /100 | #191 | Fair 4.3% |
| Ghanaians | 27.3 /100 | #192 | Fair 4.3% |
| French | 27.1 /100 | #193 | Fair 4.2% |
| Scandinavians | 25.8 /100 | #194 | Fair 4.2% |
| Nigerians | 24.6 /100 | #195 | Fair 4.2% |
| Spanish | 23.0 /100 | #196 | Fair 4.2% |
| Czechoslovakians | 22.4 /100 | #197 | Fair 4.2% |
| Immigrants | Middle Africa | 22.1 /100 | #198 | Fair 4.2% |
| Norwegians | 20.5 /100 | #199 | Fair 4.2% |
| Immigrants | North Macedonia | 20.2 /100 | #200 | Fair 4.2% |
| Finns | 18.7 /100 | #201 | Poor 4.2% |