Arab vs Tongan Nursery School
COMPARE
Arab
Tongan
Nursery School
Nursery School Comparison
Arabs
Tongans
97.9%
NURSERY SCHOOL
34.7/ 100
METRIC RATING
188th/ 347
METRIC RANK
97.8%
NURSERY SCHOOL
4.3/ 100
METRIC RATING
221st/ 347
METRIC RANK
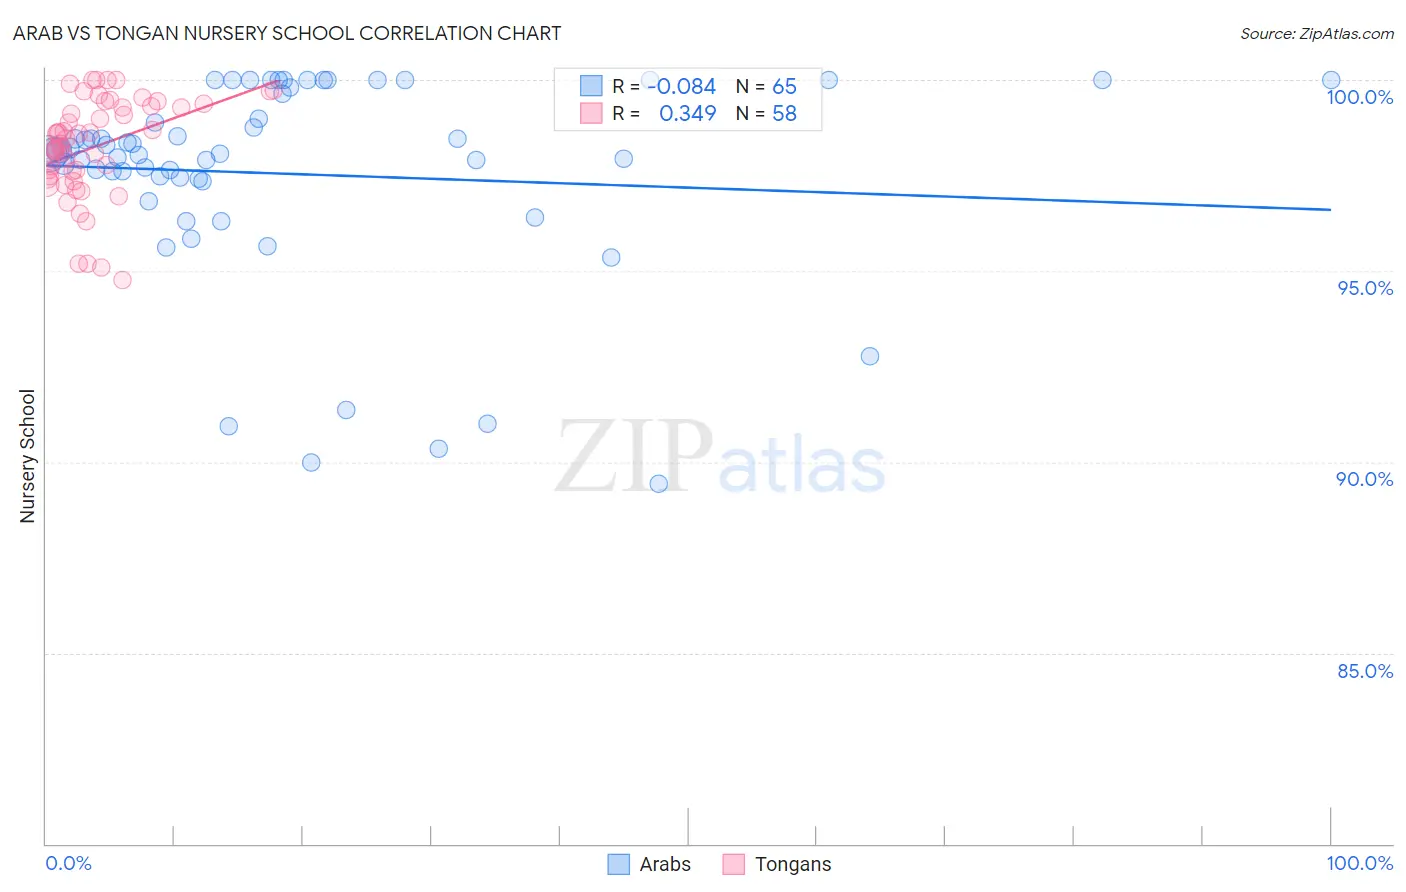
Arab vs Tongan Nursery School Correlation Chart
The statistical analysis conducted on geographies consisting of 486,872,066 people shows a slight negative correlation between the proportion of Arabs and percentage of population with at least nursery school education in the United States with a correlation coefficient (R) of -0.084 and weighted average of 97.9%. Similarly, the statistical analysis conducted on geographies consisting of 102,908,759 people shows a mild positive correlation between the proportion of Tongans and percentage of population with at least nursery school education in the United States with a correlation coefficient (R) of 0.349 and weighted average of 97.8%, a difference of 0.19%.
Nursery School Correlation Summary
| Measurement | Arab | Tongan |
| Minimum | 89.4% | 94.8% |
| Maximum | 100.0% | 100.0% |
| Range | 10.6% | 5.2% |
| Mean | 97.5% | 98.2% |
| Median | 98.1% | 98.4% |
| Interquartile 25% (IQ1) | 97.4% | 97.5% |
| Interquartile 75% (IQ3) | 99.7% | 99.3% |
| Interquartile Range (IQR) | 2.3% | 1.8% |
| Standard Deviation (Sample) | 2.7% | 1.3% |
| Standard Deviation (Population) | 2.7% | 1.3% |
Similar Demographics by Nursery School
Demographics Similar to Arabs by Nursery School
In terms of nursery school, the demographic groups most similar to Arabs are Pakistani (97.9%, a difference of 0.0%), Panamanian (97.9%, a difference of 0.0%), Immigrants from Kazakhstan (97.9%, a difference of 0.010%), Immigrants from Taiwan (97.9%, a difference of 0.010%), and Paiute (98.0%, a difference of 0.020%).
| Demographics | Rating | Rank | Nursery School |
| Egyptians | 42.8 /100 | #181 | Average 98.0% |
| Paiute | 42.0 /100 | #182 | Average 98.0% |
| Portuguese | 41.8 /100 | #183 | Average 98.0% |
| Immigrants | Poland | 41.3 /100 | #184 | Average 98.0% |
| Immigrants | Belarus | 41.0 /100 | #185 | Average 98.0% |
| Immigrants | Argentina | 40.8 /100 | #186 | Average 98.0% |
| Immigrants | Kazakhstan | 37.1 /100 | #187 | Fair 97.9% |
| Arabs | 34.7 /100 | #188 | Fair 97.9% |
| Pakistanis | 34.6 /100 | #189 | Fair 97.9% |
| Panamanians | 34.3 /100 | #190 | Fair 97.9% |
| Immigrants | Taiwan | 30.6 /100 | #191 | Fair 97.9% |
| Blacks/African Americans | 29.4 /100 | #192 | Fair 97.9% |
| Paraguayans | 27.4 /100 | #193 | Fair 97.9% |
| Mongolians | 27.3 /100 | #194 | Fair 97.9% |
| Hawaiians | 27.2 /100 | #195 | Fair 97.9% |
Demographics Similar to Tongans by Nursery School
In terms of nursery school, the demographic groups most similar to Tongans are Immigrants from Zaire (97.8%, a difference of 0.0%), Immigrants from Morocco (97.8%, a difference of 0.010%), Immigrants from Syria (97.7%, a difference of 0.010%), Immigrants from Sudan (97.7%, a difference of 0.010%), and Immigrants from Nepal (97.7%, a difference of 0.010%).
| Demographics | Rating | Rank | Nursery School |
| South American Indians | 8.0 /100 | #214 | Tragic 97.8% |
| Bahamians | 7.4 /100 | #215 | Tragic 97.8% |
| Uruguayans | 7.1 /100 | #216 | Tragic 97.8% |
| Samoans | 6.3 /100 | #217 | Tragic 97.8% |
| Immigrants | Panama | 5.3 /100 | #218 | Tragic 97.8% |
| Immigrants | Morocco | 5.1 /100 | #219 | Tragic 97.8% |
| Immigrants | Zaire | 4.4 /100 | #220 | Tragic 97.8% |
| Tongans | 4.3 /100 | #221 | Tragic 97.8% |
| Immigrants | Syria | 4.0 /100 | #222 | Tragic 97.7% |
| Immigrants | Sudan | 3.9 /100 | #223 | Tragic 97.7% |
| Immigrants | Nepal | 3.6 /100 | #224 | Tragic 97.7% |
| Immigrants | Costa Rica | 3.5 /100 | #225 | Tragic 97.7% |
| Iraqis | 3.5 /100 | #226 | Tragic 97.7% |
| Sub-Saharan Africans | 3.2 /100 | #227 | Tragic 97.7% |
| Sudanese | 3.2 /100 | #228 | Tragic 97.7% |