Arab vs Immigrants from Iran Child Poverty Among Boys Under 16
COMPARE
Arab
Immigrants from Iran
Child Poverty Among Boys Under 16
Child Poverty Among Boys Under 16 Comparison
Arabs
Immigrants from Iran
16.8%
CHILD POVERTY AMONG BOYS UNDER 16
31.1/ 100
METRIC RATING
190th/ 347
METRIC RANK
12.5%
CHILD POVERTY AMONG BOYS UNDER 16
100.0/ 100
METRIC RATING
9th/ 347
METRIC RANK
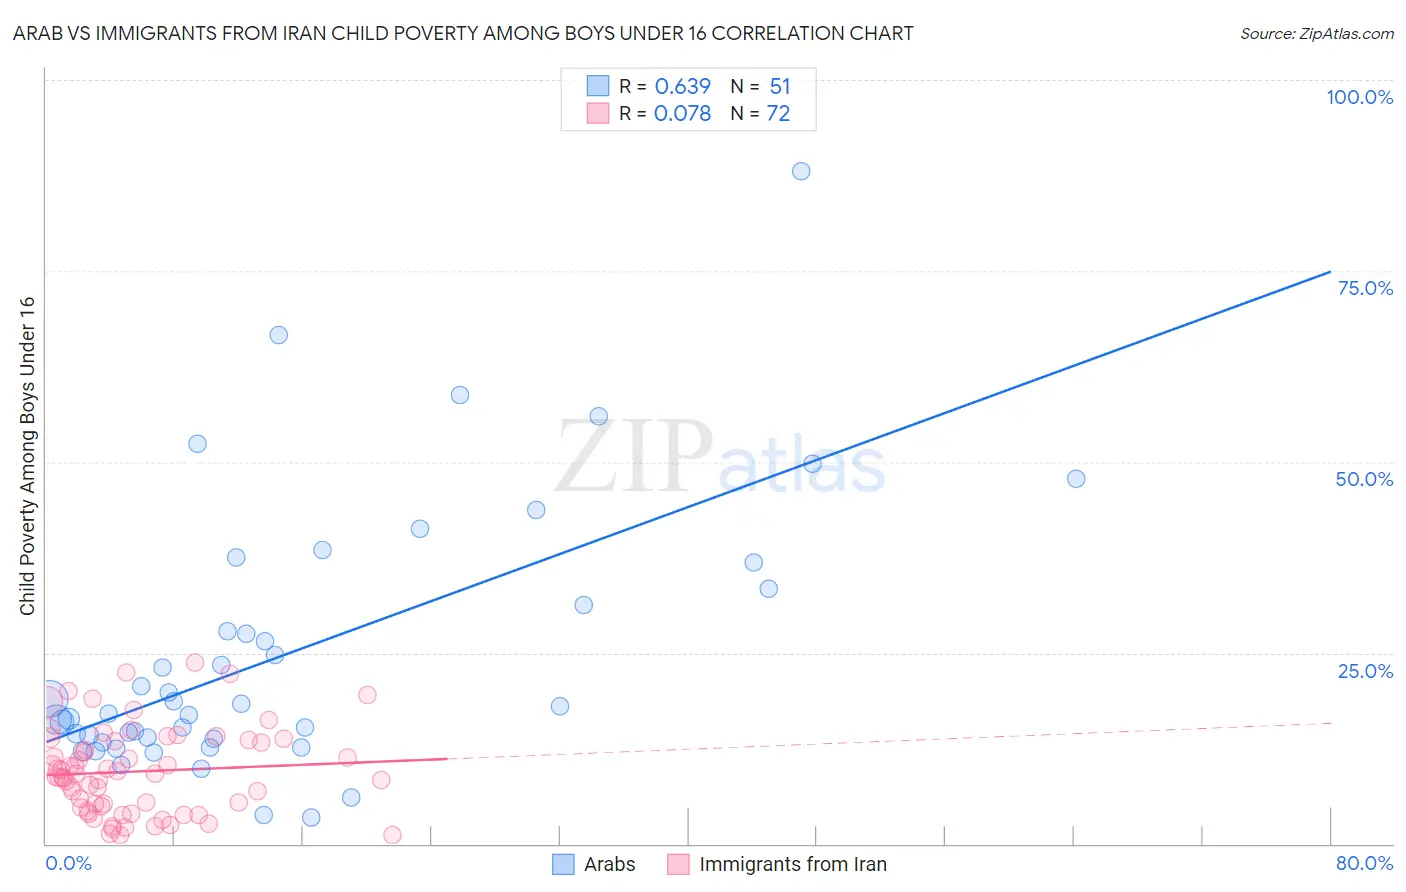
Arab vs Immigrants from Iran Child Poverty Among Boys Under 16 Correlation Chart
The statistical analysis conducted on geographies consisting of 475,195,630 people shows a significant positive correlation between the proportion of Arabs and poverty level among boys under the age of 16 in the United States with a correlation coefficient (R) of 0.639 and weighted average of 16.8%. Similarly, the statistical analysis conducted on geographies consisting of 276,154,889 people shows a slight positive correlation between the proportion of Immigrants from Iran and poverty level among boys under the age of 16 in the United States with a correlation coefficient (R) of 0.078 and weighted average of 12.5%, a difference of 33.9%.
Child Poverty Among Boys Under 16 Correlation Summary
| Measurement | Arab | Immigrants from Iran |
| Minimum | 3.4% | 1.1% |
| Maximum | 88.0% | 23.8% |
| Range | 84.6% | 22.7% |
| Mean | 24.9% | 9.5% |
| Median | 17.9% | 9.0% |
| Interquartile 25% (IQ1) | 13.7% | 4.8% |
| Interquartile 75% (IQ3) | 33.3% | 13.5% |
| Interquartile Range (IQR) | 19.6% | 8.7% |
| Standard Deviation (Sample) | 17.4% | 5.6% |
| Standard Deviation (Population) | 17.2% | 5.6% |
Similar Demographics by Child Poverty Among Boys Under 16
Demographics Similar to Arabs by Child Poverty Among Boys Under 16
In terms of child poverty among boys under 16, the demographic groups most similar to Arabs are Alaska Native (16.8%, a difference of 0.17%), Immigrants from Morocco (16.7%, a difference of 0.42%), Immigrants from South America (16.7%, a difference of 0.81%), Immigrants from Costa Rica (16.7%, a difference of 0.82%), and Hmong (16.6%, a difference of 0.90%).
| Demographics | Rating | Rank | Child Poverty Among Boys Under 16 |
| Kenyans | 41.0 /100 | #183 | Average 16.6% |
| Celtics | 40.6 /100 | #184 | Average 16.6% |
| Immigrants | Western Asia | 40.4 /100 | #185 | Average 16.6% |
| Hmong | 38.4 /100 | #186 | Fair 16.6% |
| Immigrants | Costa Rica | 37.8 /100 | #187 | Fair 16.7% |
| Immigrants | South America | 37.7 /100 | #188 | Fair 16.7% |
| Immigrants | Morocco | 34.5 /100 | #189 | Fair 16.7% |
| Arabs | 31.1 /100 | #190 | Fair 16.8% |
| Alaska Natives | 29.8 /100 | #191 | Fair 16.8% |
| Immigrants | Uganda | 21.6 /100 | #192 | Fair 17.0% |
| Immigrants | Iraq | 21.6 /100 | #193 | Fair 17.0% |
| Immigrants | Lebanon | 21.2 /100 | #194 | Fair 17.0% |
| Spanish | 20.8 /100 | #195 | Fair 17.0% |
| Spaniards | 20.5 /100 | #196 | Fair 17.1% |
| Immigrants | Kenya | 20.1 /100 | #197 | Fair 17.1% |
Demographics Similar to Immigrants from Iran by Child Poverty Among Boys Under 16
In terms of child poverty among boys under 16, the demographic groups most similar to Immigrants from Iran are Bhutanese (12.6%, a difference of 0.36%), Immigrants from Singapore (12.5%, a difference of 0.50%), Iranian (12.4%, a difference of 0.81%), Immigrants from South Central Asia (12.7%, a difference of 0.88%), and Immigrants from Hong Kong (12.3%, a difference of 2.4%).
| Demographics | Rating | Rank | Child Poverty Among Boys Under 16 |
| Immigrants | Taiwan | 100.0 /100 | #2 | Exceptional 11.0% |
| Filipinos | 100.0 /100 | #3 | Exceptional 11.1% |
| Thais | 100.0 /100 | #4 | Exceptional 11.7% |
| Chinese | 100.0 /100 | #5 | Exceptional 11.9% |
| Immigrants | Hong Kong | 100.0 /100 | #6 | Exceptional 12.3% |
| Iranians | 100.0 /100 | #7 | Exceptional 12.4% |
| Immigrants | Singapore | 100.0 /100 | #8 | Exceptional 12.5% |
| Immigrants | Iran | 100.0 /100 | #9 | Exceptional 12.5% |
| Bhutanese | 100.0 /100 | #10 | Exceptional 12.6% |
| Immigrants | South Central Asia | 100.0 /100 | #11 | Exceptional 12.7% |
| Burmese | 99.9 /100 | #12 | Exceptional 13.0% |
| Immigrants | Korea | 99.9 /100 | #13 | Exceptional 13.0% |
| Immigrants | Ireland | 99.9 /100 | #14 | Exceptional 13.1% |
| Immigrants | Japan | 99.9 /100 | #15 | Exceptional 13.1% |
| Maltese | 99.9 /100 | #16 | Exceptional 13.2% |