Arab vs South American Indian Nursery School
COMPARE
Arab
South American Indian
Nursery School
Nursery School Comparison
Arabs
South American Indians
97.9%
NURSERY SCHOOL
34.7/ 100
METRIC RATING
188th/ 347
METRIC RANK
97.8%
NURSERY SCHOOL
8.0/ 100
METRIC RATING
214th/ 347
METRIC RANK
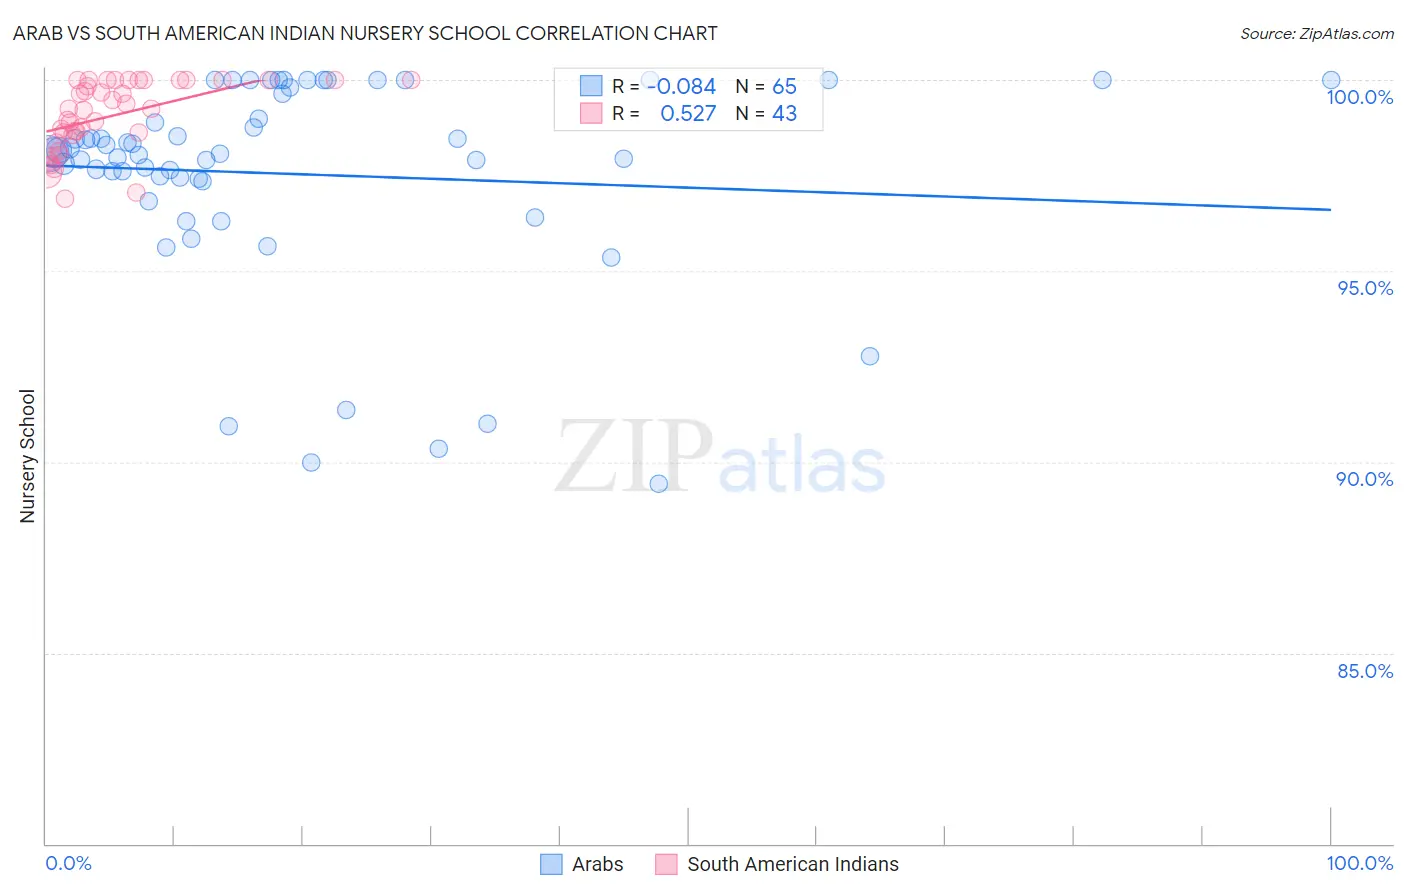
Arab vs South American Indian Nursery School Correlation Chart
The statistical analysis conducted on geographies consisting of 486,872,066 people shows a slight negative correlation between the proportion of Arabs and percentage of population with at least nursery school education in the United States with a correlation coefficient (R) of -0.084 and weighted average of 97.9%. Similarly, the statistical analysis conducted on geographies consisting of 164,573,401 people shows a substantial positive correlation between the proportion of South American Indians and percentage of population with at least nursery school education in the United States with a correlation coefficient (R) of 0.527 and weighted average of 97.8%, a difference of 0.14%.
Nursery School Correlation Summary
| Measurement | Arab | South American Indian |
| Minimum | 89.4% | 96.9% |
| Maximum | 100.0% | 100.0% |
| Range | 10.6% | 3.1% |
| Mean | 97.5% | 99.1% |
| Median | 98.1% | 99.2% |
| Interquartile 25% (IQ1) | 97.4% | 98.6% |
| Interquartile 75% (IQ3) | 99.7% | 100.0% |
| Interquartile Range (IQR) | 2.3% | 1.4% |
| Standard Deviation (Sample) | 2.7% | 0.91% |
| Standard Deviation (Population) | 2.7% | 0.89% |
Similar Demographics by Nursery School
Demographics Similar to Arabs by Nursery School
In terms of nursery school, the demographic groups most similar to Arabs are Pakistani (97.9%, a difference of 0.0%), Panamanian (97.9%, a difference of 0.0%), Immigrants from Kazakhstan (97.9%, a difference of 0.010%), Immigrants from Taiwan (97.9%, a difference of 0.010%), and Paiute (98.0%, a difference of 0.020%).
| Demographics | Rating | Rank | Nursery School |
| Egyptians | 42.8 /100 | #181 | Average 98.0% |
| Paiute | 42.0 /100 | #182 | Average 98.0% |
| Portuguese | 41.8 /100 | #183 | Average 98.0% |
| Immigrants | Poland | 41.3 /100 | #184 | Average 98.0% |
| Immigrants | Belarus | 41.0 /100 | #185 | Average 98.0% |
| Immigrants | Argentina | 40.8 /100 | #186 | Average 98.0% |
| Immigrants | Kazakhstan | 37.1 /100 | #187 | Fair 97.9% |
| Arabs | 34.7 /100 | #188 | Fair 97.9% |
| Pakistanis | 34.6 /100 | #189 | Fair 97.9% |
| Panamanians | 34.3 /100 | #190 | Fair 97.9% |
| Immigrants | Taiwan | 30.6 /100 | #191 | Fair 97.9% |
| Blacks/African Americans | 29.4 /100 | #192 | Fair 97.9% |
| Paraguayans | 27.4 /100 | #193 | Fair 97.9% |
| Mongolians | 27.3 /100 | #194 | Fair 97.9% |
| Hawaiians | 27.2 /100 | #195 | Fair 97.9% |
Demographics Similar to South American Indians by Nursery School
In terms of nursery school, the demographic groups most similar to South American Indians are Moroccan (97.8%, a difference of 0.0%), Immigrants from Bahamas (97.8%, a difference of 0.010%), Bahamian (97.8%, a difference of 0.010%), Uruguayan (97.8%, a difference of 0.010%), and Immigrants from Oceania (97.8%, a difference of 0.020%).
| Demographics | Rating | Rank | Nursery School |
| Africans | 15.4 /100 | #207 | Poor 97.9% |
| Immigrants | Northern Africa | 11.7 /100 | #208 | Poor 97.8% |
| Costa Ricans | 11.3 /100 | #209 | Poor 97.8% |
| Immigrants | Oceania | 10.2 /100 | #210 | Poor 97.8% |
| Laotians | 9.8 /100 | #211 | Tragic 97.8% |
| Immigrants | Bahamas | 8.6 /100 | #212 | Tragic 97.8% |
| Moroccans | 8.3 /100 | #213 | Tragic 97.8% |
| South American Indians | 8.0 /100 | #214 | Tragic 97.8% |
| Bahamians | 7.4 /100 | #215 | Tragic 97.8% |
| Uruguayans | 7.1 /100 | #216 | Tragic 97.8% |
| Samoans | 6.3 /100 | #217 | Tragic 97.8% |
| Immigrants | Panama | 5.3 /100 | #218 | Tragic 97.8% |
| Immigrants | Morocco | 5.1 /100 | #219 | Tragic 97.8% |
| Immigrants | Zaire | 4.4 /100 | #220 | Tragic 97.8% |
| Tongans | 4.3 /100 | #221 | Tragic 97.8% |