Arab vs Central American No Schooling Completed
COMPARE
Arab
Central American
No Schooling Completed
No Schooling Completed Comparison
Arabs
Central Americans
2.1%
NO SCHOOLING COMPLETED
46.4/ 100
METRIC RATING
175th/ 347
METRIC RANK
3.4%
NO SCHOOLING COMPLETED
0.0/ 100
METRIC RATING
332nd/ 347
METRIC RANK
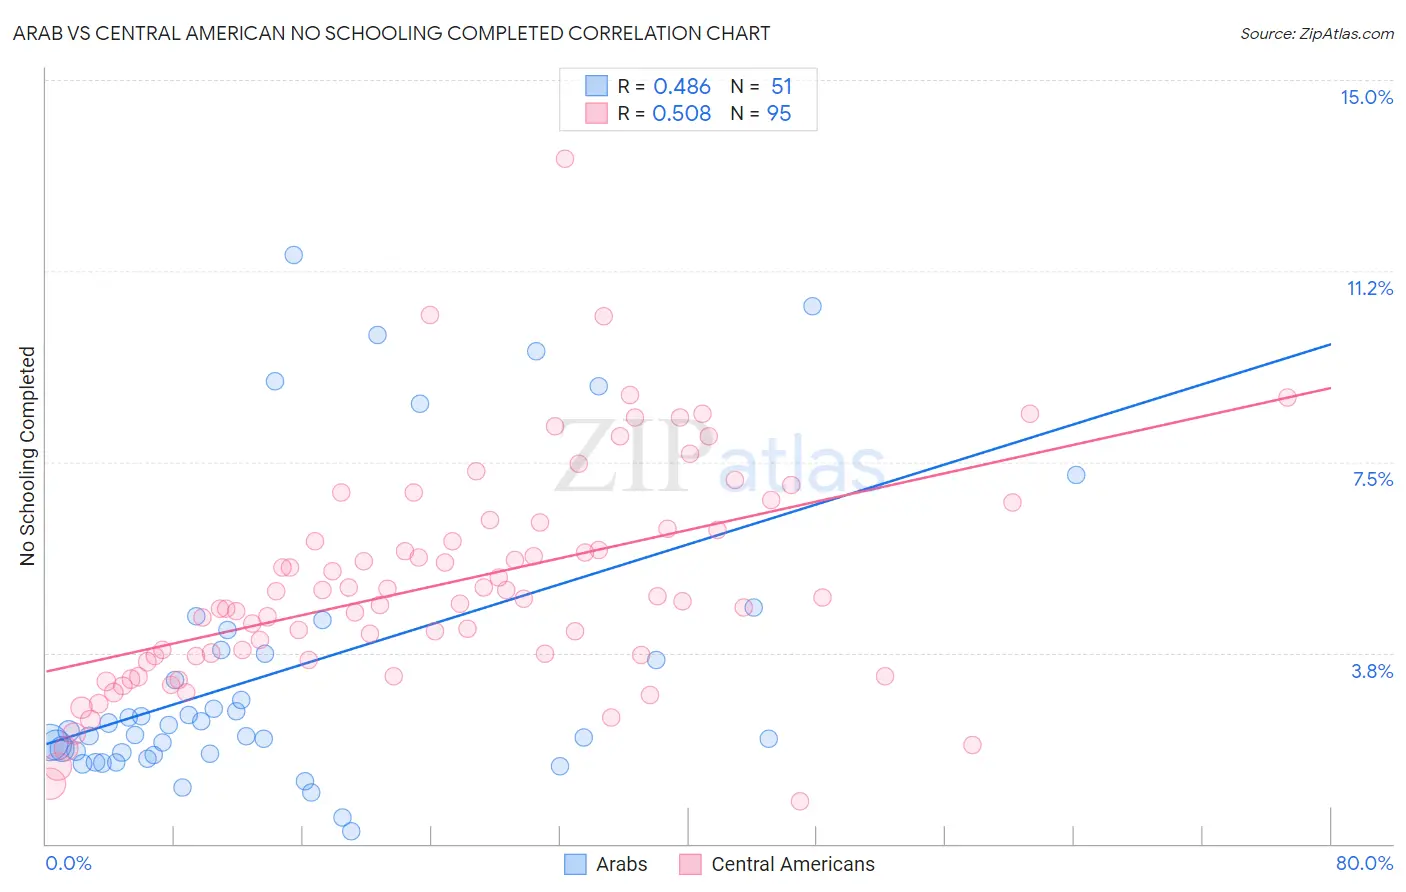
Arab vs Central American No Schooling Completed Correlation Chart
The statistical analysis conducted on geographies consisting of 479,384,082 people shows a moderate positive correlation between the proportion of Arabs and percentage of population with no schooling in the United States with a correlation coefficient (R) of 0.486 and weighted average of 2.1%. Similarly, the statistical analysis conducted on geographies consisting of 497,423,122 people shows a substantial positive correlation between the proportion of Central Americans and percentage of population with no schooling in the United States with a correlation coefficient (R) of 0.508 and weighted average of 3.4%, a difference of 61.7%.
No Schooling Completed Correlation Summary
| Measurement | Arab | Central American |
| Minimum | 0.23% | 0.83% |
| Maximum | 11.6% | 13.5% |
| Range | 11.3% | 12.6% |
| Mean | 3.4% | 5.1% |
| Median | 2.2% | 4.8% |
| Interquartile 25% (IQ1) | 1.8% | 3.7% |
| Interquartile 75% (IQ3) | 3.8% | 6.2% |
| Interquartile Range (IQR) | 2.0% | 2.5% |
| Standard Deviation (Sample) | 2.8% | 2.2% |
| Standard Deviation (Population) | 2.8% | 2.1% |
Similar Demographics by No Schooling Completed
Demographics Similar to Arabs by No Schooling Completed
In terms of no schooling completed, the demographic groups most similar to Arabs are Panamanian (2.1%, a difference of 0.17%), Arapaho (2.1%, a difference of 0.19%), Pakistani (2.1%, a difference of 0.23%), Immigrants from Kazakhstan (2.1%, a difference of 0.29%), and Portuguese (2.1%, a difference of 0.35%).
| Demographics | Rating | Rank | No Schooling Completed |
| Cheyenne | 58.6 /100 | #168 | Average 2.1% |
| Apache | 56.7 /100 | #169 | Average 2.1% |
| Argentineans | 56.0 /100 | #170 | Average 2.1% |
| Immigrants | Poland | 55.2 /100 | #171 | Average 2.1% |
| Immigrants | Argentina | 52.7 /100 | #172 | Average 2.1% |
| Immigrants | Belarus | 51.8 /100 | #173 | Average 2.1% |
| Immigrants | Micronesia | 50.0 /100 | #174 | Average 2.1% |
| Arabs | 46.4 /100 | #175 | Average 2.1% |
| Panamanians | 45.2 /100 | #176 | Average 2.1% |
| Arapaho | 45.0 /100 | #177 | Average 2.1% |
| Pakistanis | 44.7 /100 | #178 | Average 2.1% |
| Immigrants | Kazakhstan | 44.3 /100 | #179 | Average 2.1% |
| Portuguese | 43.9 /100 | #180 | Average 2.1% |
| Immigrants | Taiwan | 42.6 /100 | #181 | Average 2.1% |
| French American Indians | 42.2 /100 | #182 | Average 2.1% |
Demographics Similar to Central Americans by No Schooling Completed
In terms of no schooling completed, the demographic groups most similar to Central Americans are Immigrants from Dominican Republic (3.4%, a difference of 0.060%), Japanese (3.3%, a difference of 1.5%), Immigrants from Armenia (3.3%, a difference of 1.5%), Guatemalan (3.5%, a difference of 1.8%), and Immigrants from Vietnam (3.3%, a difference of 2.0%).
| Demographics | Rating | Rank | No Schooling Completed |
| Dominicans | 0.0 /100 | #325 | Tragic 3.2% |
| Indonesians | 0.0 /100 | #326 | Tragic 3.2% |
| Immigrants | Latin America | 0.0 /100 | #327 | Tragic 3.3% |
| Mexicans | 0.0 /100 | #328 | Tragic 3.3% |
| Immigrants | Vietnam | 0.0 /100 | #329 | Tragic 3.3% |
| Immigrants | Armenia | 0.0 /100 | #330 | Tragic 3.3% |
| Japanese | 0.0 /100 | #331 | Tragic 3.3% |
| Central Americans | 0.0 /100 | #332 | Tragic 3.4% |
| Immigrants | Dominican Republic | 0.0 /100 | #333 | Tragic 3.4% |
| Guatemalans | 0.0 /100 | #334 | Tragic 3.5% |
| Immigrants | Cambodia | 0.0 /100 | #335 | Tragic 3.5% |
| Immigrants | Fiji | 0.0 /100 | #336 | Tragic 3.5% |
| Immigrants | Cabo Verde | 0.0 /100 | #337 | Tragic 3.5% |
| Bangladeshis | 0.0 /100 | #338 | Tragic 3.5% |
| Yakama | 0.0 /100 | #339 | Tragic 3.6% |