Immigrants from Czechoslovakia vs Central American No Schooling Completed
COMPARE
Immigrants from Czechoslovakia
Central American
No Schooling Completed
No Schooling Completed Comparison
Immigrants from Czechoslovakia
Central Americans
1.8%
NO SCHOOLING COMPLETED
97.9/ 100
METRIC RATING
101st/ 347
METRIC RANK
3.4%
NO SCHOOLING COMPLETED
0.0/ 100
METRIC RATING
332nd/ 347
METRIC RANK
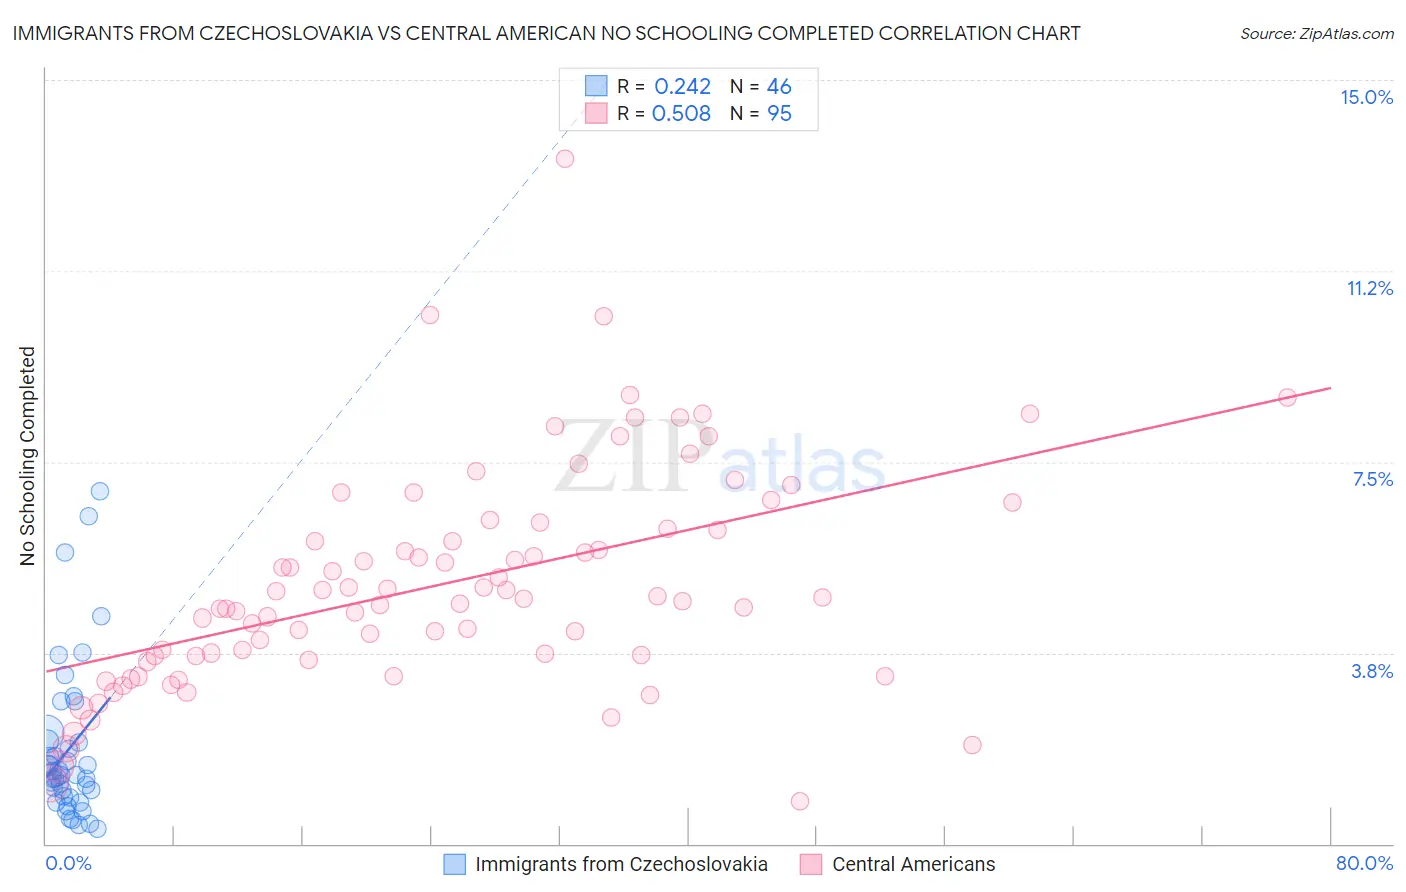
Immigrants from Czechoslovakia vs Central American No Schooling Completed Correlation Chart
The statistical analysis conducted on geographies consisting of 194,474,881 people shows a weak positive correlation between the proportion of Immigrants from Czechoslovakia and percentage of population with no schooling in the United States with a correlation coefficient (R) of 0.242 and weighted average of 1.8%. Similarly, the statistical analysis conducted on geographies consisting of 497,423,122 people shows a substantial positive correlation between the proportion of Central Americans and percentage of population with no schooling in the United States with a correlation coefficient (R) of 0.508 and weighted average of 3.4%, a difference of 86.5%.
No Schooling Completed Correlation Summary
| Measurement | Immigrants from Czechoslovakia | Central American |
| Minimum | 0.29% | 0.83% |
| Maximum | 6.9% | 13.5% |
| Range | 6.6% | 12.6% |
| Mean | 1.9% | 5.1% |
| Median | 1.4% | 4.8% |
| Interquartile 25% (IQ1) | 0.93% | 3.7% |
| Interquartile 75% (IQ3) | 2.0% | 6.2% |
| Interquartile Range (IQR) | 1.1% | 2.5% |
| Standard Deviation (Sample) | 1.5% | 2.2% |
| Standard Deviation (Population) | 1.5% | 2.1% |
Similar Demographics by No Schooling Completed
Demographics Similar to Immigrants from Czechoslovakia by No Schooling Completed
In terms of no schooling completed, the demographic groups most similar to Immigrants from Czechoslovakia are Immigrants from Switzerland (1.8%, a difference of 0.0%), Basque (1.8%, a difference of 0.060%), Immigrants from Singapore (1.8%, a difference of 0.30%), Choctaw (1.8%, a difference of 0.49%), and Thai (1.8%, a difference of 0.63%).
| Demographics | Rating | Rank | No Schooling Completed |
| Immigrants | Nonimmigrants | 98.5 /100 | #94 | Exceptional 1.8% |
| Puget Sound Salish | 98.5 /100 | #95 | Exceptional 1.8% |
| Bhutanese | 98.4 /100 | #96 | Exceptional 1.8% |
| Immigrants | Ireland | 98.4 /100 | #97 | Exceptional 1.8% |
| Iranians | 98.2 /100 | #98 | Exceptional 1.8% |
| Choctaw | 98.1 /100 | #99 | Exceptional 1.8% |
| Immigrants | Singapore | 98.0 /100 | #100 | Exceptional 1.8% |
| Immigrants | Czechoslovakia | 97.9 /100 | #101 | Exceptional 1.8% |
| Immigrants | Switzerland | 97.9 /100 | #102 | Exceptional 1.8% |
| Basques | 97.9 /100 | #103 | Exceptional 1.8% |
| Thais | 97.5 /100 | #104 | Exceptional 1.8% |
| German Russians | 97.5 /100 | #105 | Exceptional 1.8% |
| Immigrants | France | 97.3 /100 | #106 | Exceptional 1.8% |
| Yugoslavians | 97.2 /100 | #107 | Exceptional 1.8% |
| Okinawans | 97.1 /100 | #108 | Exceptional 1.8% |
Demographics Similar to Central Americans by No Schooling Completed
In terms of no schooling completed, the demographic groups most similar to Central Americans are Immigrants from Dominican Republic (3.4%, a difference of 0.060%), Japanese (3.3%, a difference of 1.5%), Immigrants from Armenia (3.3%, a difference of 1.5%), Guatemalan (3.5%, a difference of 1.8%), and Immigrants from Vietnam (3.3%, a difference of 2.0%).
| Demographics | Rating | Rank | No Schooling Completed |
| Dominicans | 0.0 /100 | #325 | Tragic 3.2% |
| Indonesians | 0.0 /100 | #326 | Tragic 3.2% |
| Immigrants | Latin America | 0.0 /100 | #327 | Tragic 3.3% |
| Mexicans | 0.0 /100 | #328 | Tragic 3.3% |
| Immigrants | Vietnam | 0.0 /100 | #329 | Tragic 3.3% |
| Immigrants | Armenia | 0.0 /100 | #330 | Tragic 3.3% |
| Japanese | 0.0 /100 | #331 | Tragic 3.3% |
| Central Americans | 0.0 /100 | #332 | Tragic 3.4% |
| Immigrants | Dominican Republic | 0.0 /100 | #333 | Tragic 3.4% |
| Guatemalans | 0.0 /100 | #334 | Tragic 3.5% |
| Immigrants | Cambodia | 0.0 /100 | #335 | Tragic 3.5% |
| Immigrants | Fiji | 0.0 /100 | #336 | Tragic 3.5% |
| Immigrants | Cabo Verde | 0.0 /100 | #337 | Tragic 3.5% |
| Bangladeshis | 0.0 /100 | #338 | Tragic 3.5% |
| Yakama | 0.0 /100 | #339 | Tragic 3.6% |