Arab vs Central American In Labor Force | Age 30-34
COMPARE
Arab
Central American
In Labor Force | Age 30-34
In Labor Force | Age 30-34 Comparison
Arabs
Central Americans
84.3%
IN LABOR FORCE | AGE 30-34
8.9/ 100
METRIC RATING
208th/ 347
METRIC RANK
84.0%
IN LABOR FORCE | AGE 30-34
0.9/ 100
METRIC RATING
246th/ 347
METRIC RANK
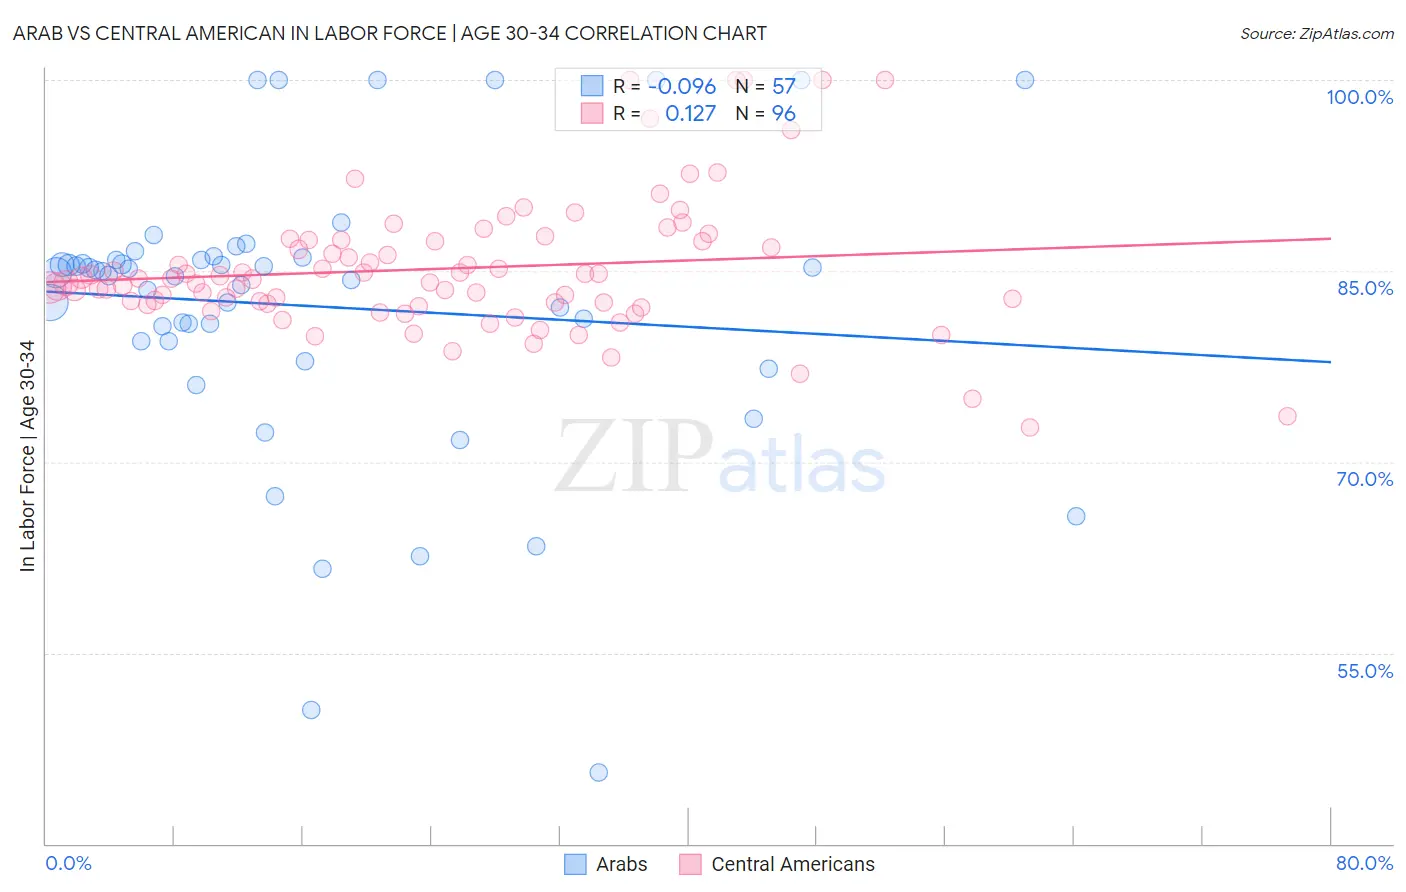
Arab vs Central American In Labor Force | Age 30-34 Correlation Chart
The statistical analysis conducted on geographies consisting of 486,369,890 people shows a slight negative correlation between the proportion of Arabs and labor force participation rate among population between the ages 30 and 34 in the United States with a correlation coefficient (R) of -0.096 and weighted average of 84.3%. Similarly, the statistical analysis conducted on geographies consisting of 504,052,448 people shows a poor positive correlation between the proportion of Central Americans and labor force participation rate among population between the ages 30 and 34 in the United States with a correlation coefficient (R) of 0.127 and weighted average of 84.0%, a difference of 0.42%.
In Labor Force | Age 30-34 Correlation Summary
| Measurement | Arab | Central American |
| Minimum | 45.6% | 72.7% |
| Maximum | 100.0% | 100.0% |
| Range | 54.4% | 27.3% |
| Mean | 82.2% | 85.2% |
| Median | 84.9% | 84.4% |
| Interquartile 25% (IQ1) | 79.5% | 82.5% |
| Interquartile 75% (IQ3) | 86.0% | 87.4% |
| Interquartile Range (IQR) | 6.5% | 4.9% |
| Standard Deviation (Sample) | 11.1% | 5.3% |
| Standard Deviation (Population) | 11.0% | 5.3% |
Similar Demographics by In Labor Force | Age 30-34
Demographics Similar to Arabs by In Labor Force | Age 30-34
In terms of in labor force | age 30-34, the demographic groups most similar to Arabs are Jamaican (84.3%, a difference of 0.0%), Indonesian (84.3%, a difference of 0.0%), Japanese (84.3%, a difference of 0.0%), Bangladeshi (84.3%, a difference of 0.010%), and Immigrants from Western Asia (84.3%, a difference of 0.010%).
| Demographics | Rating | Rank | In Labor Force | Age 30-34 |
| Trinidadians and Tobagonians | 18.2 /100 | #201 | Poor 84.5% |
| Immigrants | West Indies | 18.1 /100 | #202 | Poor 84.5% |
| Canadians | 15.4 /100 | #203 | Poor 84.4% |
| Ecuadorians | 14.2 /100 | #204 | Poor 84.4% |
| French | 13.8 /100 | #205 | Poor 84.4% |
| Lebanese | 10.6 /100 | #206 | Poor 84.4% |
| Bangladeshis | 9.4 /100 | #207 | Tragic 84.3% |
| Arabs | 8.9 /100 | #208 | Tragic 84.3% |
| Jamaicans | 8.8 /100 | #209 | Tragic 84.3% |
| Indonesians | 8.8 /100 | #210 | Tragic 84.3% |
| Japanese | 8.8 /100 | #211 | Tragic 84.3% |
| Immigrants | Western Asia | 8.2 /100 | #212 | Tragic 84.3% |
| Immigrants | Jamaica | 7.9 /100 | #213 | Tragic 84.3% |
| Immigrants | Germany | 7.2 /100 | #214 | Tragic 84.3% |
| Europeans | 7.2 /100 | #215 | Tragic 84.3% |
Demographics Similar to Central Americans by In Labor Force | Age 30-34
In terms of in labor force | age 30-34, the demographic groups most similar to Central Americans are Basque (84.0%, a difference of 0.0%), Immigrants from Venezuela (84.0%, a difference of 0.0%), British West Indian (84.0%, a difference of 0.020%), Immigrants from Caribbean (84.0%, a difference of 0.030%), and Portuguese (84.0%, a difference of 0.030%).
| Demographics | Rating | Rank | In Labor Force | Age 30-34 |
| English | 1.4 /100 | #239 | Tragic 84.0% |
| Venezuelans | 1.3 /100 | #240 | Tragic 84.0% |
| Immigrants | Portugal | 1.2 /100 | #241 | Tragic 84.0% |
| Immigrants | Oceania | 1.1 /100 | #242 | Tragic 84.0% |
| Immigrants | Caribbean | 1.1 /100 | #243 | Tragic 84.0% |
| Basques | 0.9 /100 | #244 | Tragic 84.0% |
| Immigrants | Venezuela | 0.9 /100 | #245 | Tragic 84.0% |
| Central Americans | 0.9 /100 | #246 | Tragic 84.0% |
| British West Indians | 0.8 /100 | #247 | Tragic 84.0% |
| Portuguese | 0.8 /100 | #248 | Tragic 84.0% |
| Immigrants | Dominica | 0.7 /100 | #249 | Tragic 84.0% |
| Immigrants | Iraq | 0.7 /100 | #250 | Tragic 83.9% |
| Nicaraguans | 0.6 /100 | #251 | Tragic 83.9% |
| Bahamians | 0.6 /100 | #252 | Tragic 83.9% |
| Immigrants | Nicaragua | 0.6 /100 | #253 | Tragic 83.9% |