Arab vs Argentinean No Schooling Completed
COMPARE
Arab
Argentinean
No Schooling Completed
No Schooling Completed Comparison
Arabs
Argentineans
2.1%
NO SCHOOLING COMPLETED
46.4/ 100
METRIC RATING
175th/ 347
METRIC RANK
2.1%
NO SCHOOLING COMPLETED
56.0/ 100
METRIC RATING
170th/ 347
METRIC RANK
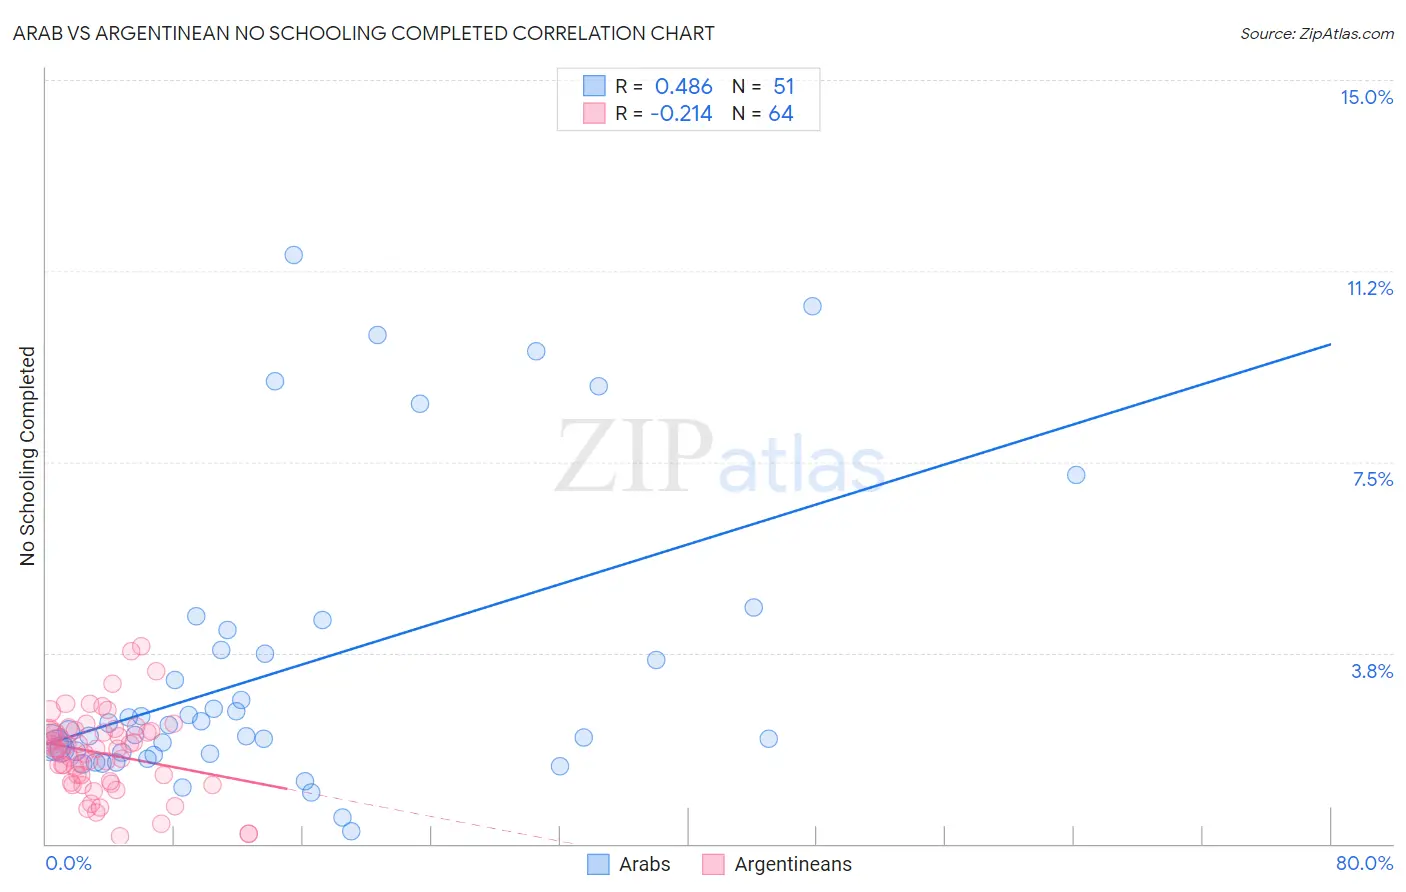
Arab vs Argentinean No Schooling Completed Correlation Chart
The statistical analysis conducted on geographies consisting of 479,384,082 people shows a moderate positive correlation between the proportion of Arabs and percentage of population with no schooling in the United States with a correlation coefficient (R) of 0.486 and weighted average of 2.1%. Similarly, the statistical analysis conducted on geographies consisting of 295,019,263 people shows a weak negative correlation between the proportion of Argentineans and percentage of population with no schooling in the United States with a correlation coefficient (R) of -0.214 and weighted average of 2.1%, a difference of 1.3%.
No Schooling Completed Correlation Summary
| Measurement | Arab | Argentinean |
| Minimum | 0.23% | 0.14% |
| Maximum | 11.6% | 3.9% |
| Range | 11.3% | 3.7% |
| Mean | 3.4% | 1.8% |
| Median | 2.2% | 1.8% |
| Interquartile 25% (IQ1) | 1.8% | 1.2% |
| Interquartile 75% (IQ3) | 3.8% | 2.2% |
| Interquartile Range (IQR) | 2.0% | 0.99% |
| Standard Deviation (Sample) | 2.8% | 0.79% |
| Standard Deviation (Population) | 2.8% | 0.79% |
Demographics Similar to Arabs and Argentineans by No Schooling Completed
In terms of no schooling completed, the demographic groups most similar to Arabs are Panamanian (2.1%, a difference of 0.17%), Arapaho (2.1%, a difference of 0.19%), Pakistani (2.1%, a difference of 0.23%), Immigrants from Kazakhstan (2.1%, a difference of 0.29%), and Portuguese (2.1%, a difference of 0.35%). Similarly, the demographic groups most similar to Argentineans are Apache (2.1%, a difference of 0.090%), Immigrants from Poland (2.1%, a difference of 0.11%), Cheyenne (2.1%, a difference of 0.36%), Egyptian (2.1%, a difference of 0.44%), and Immigrants from Argentina (2.1%, a difference of 0.45%).
| Demographics | Rating | Rank | No Schooling Completed |
| Immigrants | Brazil | 63.8 /100 | #162 | Good 2.1% |
| Albanians | 62.2 /100 | #163 | Good 2.1% |
| Comanche | 60.7 /100 | #164 | Good 2.1% |
| Brazilians | 60.2 /100 | #165 | Good 2.1% |
| Dutch West Indians | 59.9 /100 | #166 | Average 2.1% |
| Egyptians | 59.2 /100 | #167 | Average 2.1% |
| Cheyenne | 58.6 /100 | #168 | Average 2.1% |
| Apache | 56.7 /100 | #169 | Average 2.1% |
| Argentineans | 56.0 /100 | #170 | Average 2.1% |
| Immigrants | Poland | 55.2 /100 | #171 | Average 2.1% |
| Immigrants | Argentina | 52.7 /100 | #172 | Average 2.1% |
| Immigrants | Belarus | 51.8 /100 | #173 | Average 2.1% |
| Immigrants | Micronesia | 50.0 /100 | #174 | Average 2.1% |
| Arabs | 46.4 /100 | #175 | Average 2.1% |
| Panamanians | 45.2 /100 | #176 | Average 2.1% |
| Arapaho | 45.0 /100 | #177 | Average 2.1% |
| Pakistanis | 44.7 /100 | #178 | Average 2.1% |
| Immigrants | Kazakhstan | 44.3 /100 | #179 | Average 2.1% |
| Portuguese | 43.9 /100 | #180 | Average 2.1% |
| Immigrants | Taiwan | 42.6 /100 | #181 | Average 2.1% |
| French American Indians | 42.2 /100 | #182 | Average 2.1% |