Arab vs Uruguayan No Schooling Completed
COMPARE
Arab
Uruguayan
No Schooling Completed
No Schooling Completed Comparison
Arabs
Uruguayans
2.1%
NO SCHOOLING COMPLETED
46.4/ 100
METRIC RATING
175th/ 347
METRIC RANK
2.2%
NO SCHOOLING COMPLETED
11.0/ 100
METRIC RATING
208th/ 347
METRIC RANK
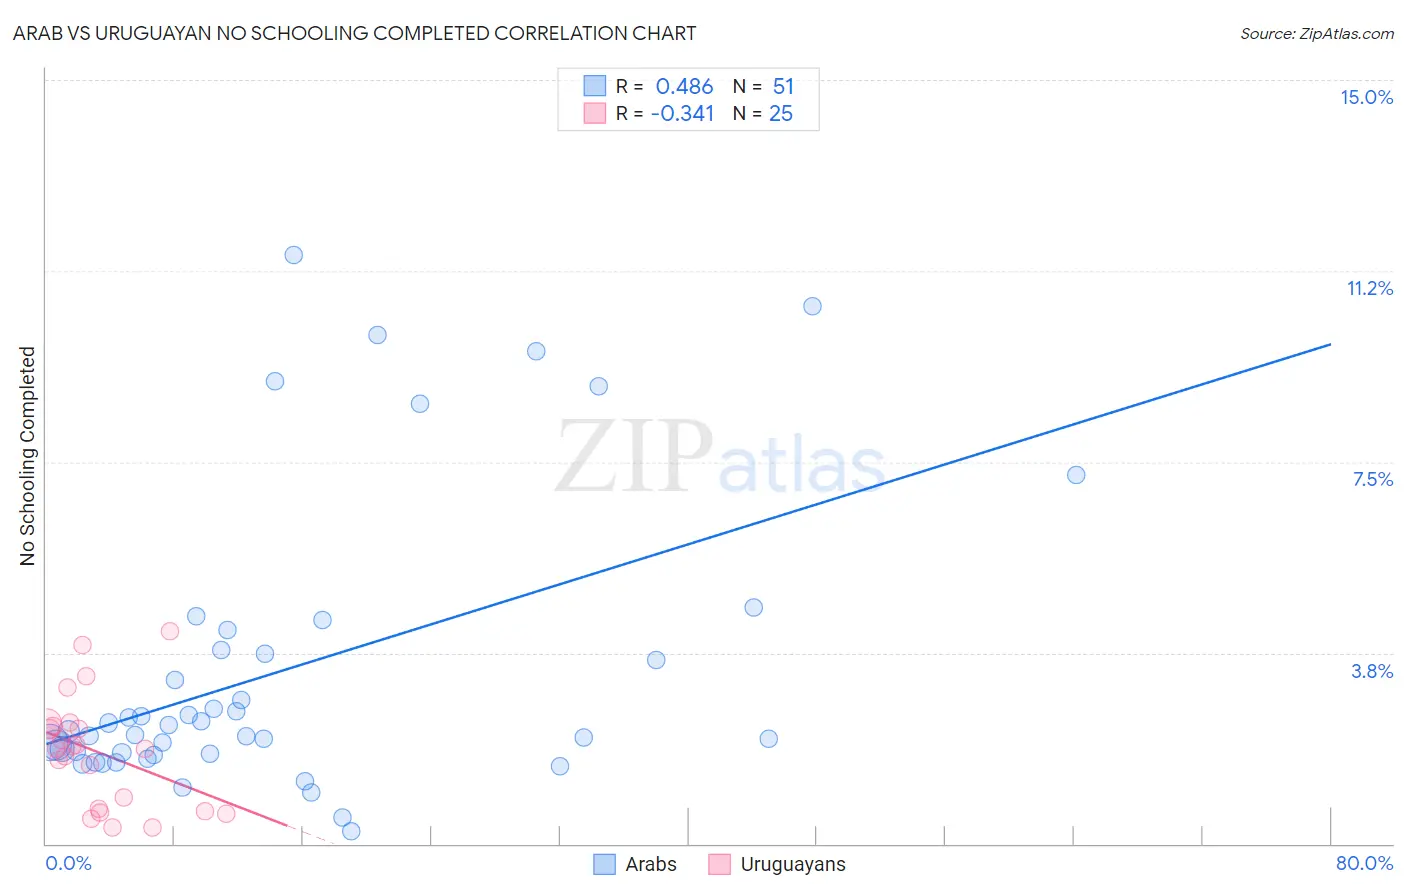
Arab vs Uruguayan No Schooling Completed Correlation Chart
The statistical analysis conducted on geographies consisting of 479,384,082 people shows a moderate positive correlation between the proportion of Arabs and percentage of population with no schooling in the United States with a correlation coefficient (R) of 0.486 and weighted average of 2.1%. Similarly, the statistical analysis conducted on geographies consisting of 144,399,901 people shows a mild negative correlation between the proportion of Uruguayans and percentage of population with no schooling in the United States with a correlation coefficient (R) of -0.341 and weighted average of 2.2%, a difference of 6.5%.
No Schooling Completed Correlation Summary
| Measurement | Arab | Uruguayan |
| Minimum | 0.23% | 0.31% |
| Maximum | 11.6% | 4.2% |
| Range | 11.3% | 3.9% |
| Mean | 3.4% | 1.8% |
| Median | 2.2% | 1.9% |
| Interquartile 25% (IQ1) | 1.8% | 0.65% |
| Interquartile 75% (IQ3) | 3.8% | 2.3% |
| Interquartile Range (IQR) | 2.0% | 1.7% |
| Standard Deviation (Sample) | 2.8% | 1.1% |
| Standard Deviation (Population) | 2.8% | 1.1% |
Similar Demographics by No Schooling Completed
Demographics Similar to Arabs by No Schooling Completed
In terms of no schooling completed, the demographic groups most similar to Arabs are Panamanian (2.1%, a difference of 0.17%), Arapaho (2.1%, a difference of 0.19%), Pakistani (2.1%, a difference of 0.23%), Immigrants from Kazakhstan (2.1%, a difference of 0.29%), and Portuguese (2.1%, a difference of 0.35%).
| Demographics | Rating | Rank | No Schooling Completed |
| Cheyenne | 58.6 /100 | #168 | Average 2.1% |
| Apache | 56.7 /100 | #169 | Average 2.1% |
| Argentineans | 56.0 /100 | #170 | Average 2.1% |
| Immigrants | Poland | 55.2 /100 | #171 | Average 2.1% |
| Immigrants | Argentina | 52.7 /100 | #172 | Average 2.1% |
| Immigrants | Belarus | 51.8 /100 | #173 | Average 2.1% |
| Immigrants | Micronesia | 50.0 /100 | #174 | Average 2.1% |
| Arabs | 46.4 /100 | #175 | Average 2.1% |
| Panamanians | 45.2 /100 | #176 | Average 2.1% |
| Arapaho | 45.0 /100 | #177 | Average 2.1% |
| Pakistanis | 44.7 /100 | #178 | Average 2.1% |
| Immigrants | Kazakhstan | 44.3 /100 | #179 | Average 2.1% |
| Portuguese | 43.9 /100 | #180 | Average 2.1% |
| Immigrants | Taiwan | 42.6 /100 | #181 | Average 2.1% |
| French American Indians | 42.2 /100 | #182 | Average 2.1% |
Demographics Similar to Uruguayans by No Schooling Completed
In terms of no schooling completed, the demographic groups most similar to Uruguayans are South American Indian (2.2%, a difference of 0.0%), Immigrants from Bahamas (2.2%, a difference of 0.19%), Bahamian (2.2%, a difference of 0.19%), Immigrants from Oceania (2.2%, a difference of 0.25%), and Native/Alaskan (2.2%, a difference of 0.33%).
| Demographics | Rating | Rank | No Schooling Completed |
| Costa Ricans | 17.1 /100 | #201 | Poor 2.2% |
| Moroccans | 13.7 /100 | #202 | Poor 2.2% |
| Laotians | 13.3 /100 | #203 | Poor 2.2% |
| Hopi | 12.9 /100 | #204 | Poor 2.2% |
| Immigrants | Bahamas | 11.6 /100 | #205 | Poor 2.2% |
| Bahamians | 11.6 /100 | #206 | Poor 2.2% |
| South American Indians | 11.0 /100 | #207 | Poor 2.2% |
| Uruguayans | 11.0 /100 | #208 | Poor 2.2% |
| Immigrants | Oceania | 10.2 /100 | #209 | Poor 2.2% |
| Natives/Alaskans | 10.0 /100 | #210 | Tragic 2.2% |
| Immigrants | Panama | 8.8 /100 | #211 | Tragic 2.3% |
| Immigrants | Morocco | 8.7 /100 | #212 | Tragic 2.3% |
| Ute | 8.2 /100 | #213 | Tragic 2.3% |
| Samoans | 8.2 /100 | #214 | Tragic 2.3% |
| Immigrants | Zaire | 7.2 /100 | #215 | Tragic 2.3% |