Immigrants from Cambodia vs English Doctorate Degree
COMPARE
Immigrants from Cambodia
English
Doctorate Degree
Doctorate Degree Comparison
Immigrants from Cambodia
English
1.5%
DOCTORATE DEGREE
1.0/ 100
METRIC RATING
254th/ 347
METRIC RANK
1.9%
DOCTORATE DEGREE
75.9/ 100
METRIC RATING
150th/ 347
METRIC RANK
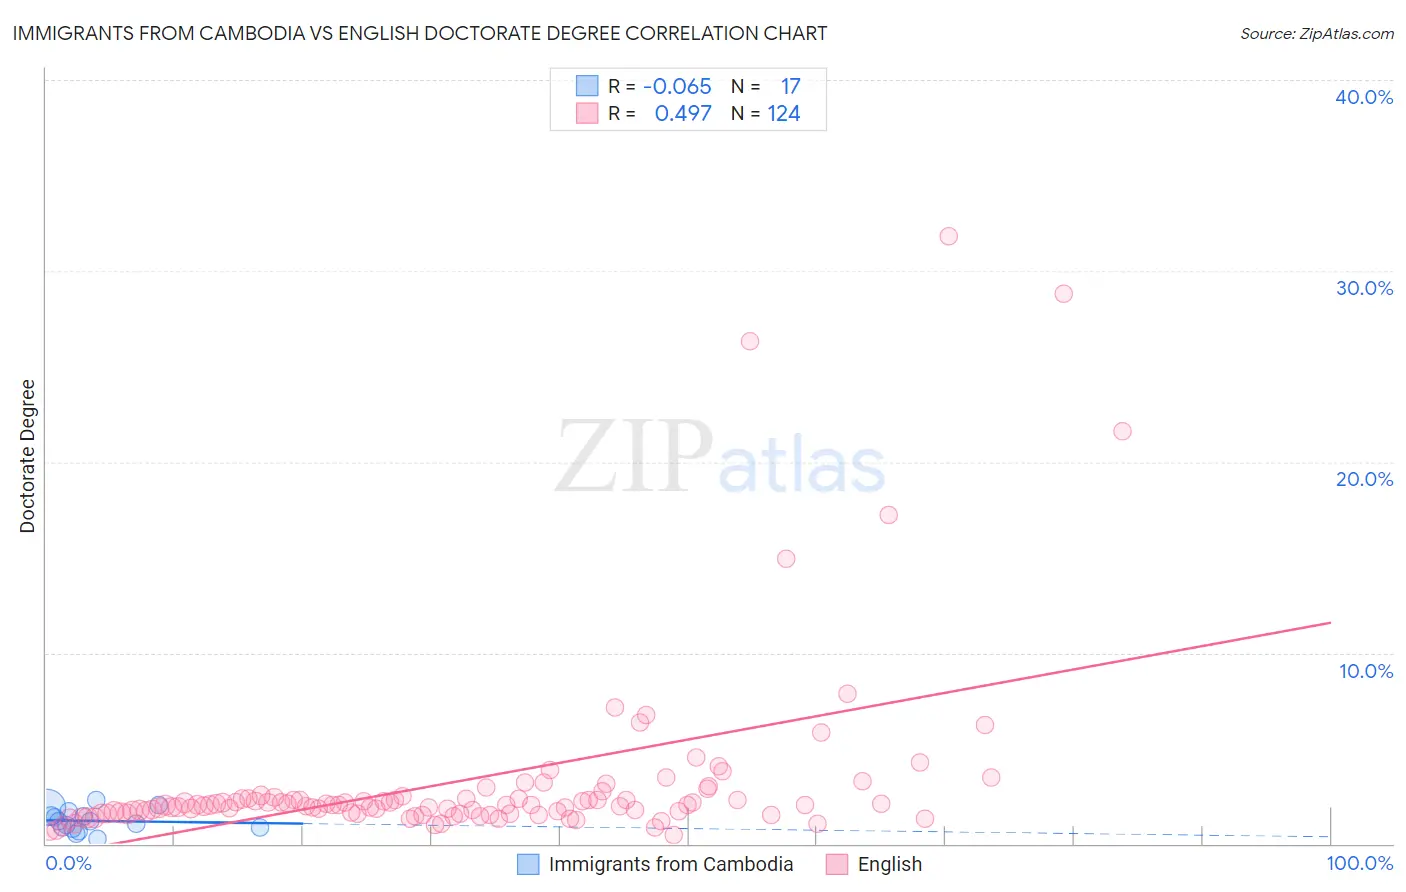
Immigrants from Cambodia vs English Doctorate Degree Correlation Chart
The statistical analysis conducted on geographies consisting of 204,355,186 people shows a slight negative correlation between the proportion of Immigrants from Cambodia and percentage of population with at least doctorate degree education in the United States with a correlation coefficient (R) of -0.065 and weighted average of 1.5%. Similarly, the statistical analysis conducted on geographies consisting of 550,351,908 people shows a moderate positive correlation between the proportion of English and percentage of population with at least doctorate degree education in the United States with a correlation coefficient (R) of 0.497 and weighted average of 1.9%, a difference of 25.3%.
Doctorate Degree Correlation Summary
| Measurement | Immigrants from Cambodia | English |
| Minimum | 0.29% | 0.49% |
| Maximum | 2.3% | 31.8% |
| Range | 2.0% | 31.3% |
| Mean | 1.2% | 3.3% |
| Median | 1.2% | 2.0% |
| Interquartile 25% (IQ1) | 0.82% | 1.6% |
| Interquartile 75% (IQ3) | 1.6% | 2.4% |
| Interquartile Range (IQR) | 0.74% | 0.77% |
| Standard Deviation (Sample) | 0.54% | 4.9% |
| Standard Deviation (Population) | 0.53% | 4.9% |
Similar Demographics by Doctorate Degree
Demographics Similar to Immigrants from Cambodia by Doctorate Degree
In terms of doctorate degree, the demographic groups most similar to Immigrants from Cambodia are Trinidadian and Tobagonian (1.5%, a difference of 0.010%), Central American Indian (1.5%, a difference of 0.050%), American (1.5%, a difference of 0.13%), Chippewa (1.5%, a difference of 0.27%), and Yuman (1.5%, a difference of 0.28%).
| Demographics | Rating | Rank | Doctorate Degree |
| Comanche | 1.8 /100 | #247 | Tragic 1.6% |
| Africans | 1.8 /100 | #248 | Tragic 1.6% |
| Potawatomi | 1.6 /100 | #249 | Tragic 1.6% |
| Immigrants | Fiji | 1.6 /100 | #250 | Tragic 1.6% |
| Apache | 1.3 /100 | #251 | Tragic 1.5% |
| Yuman | 1.1 /100 | #252 | Tragic 1.5% |
| Americans | 1.0 /100 | #253 | Tragic 1.5% |
| Immigrants | Cambodia | 1.0 /100 | #254 | Tragic 1.5% |
| Trinidadians and Tobagonians | 1.0 /100 | #255 | Tragic 1.5% |
| Central American Indians | 1.0 /100 | #256 | Tragic 1.5% |
| Chippewa | 0.9 /100 | #257 | Tragic 1.5% |
| Immigrants | West Indies | 0.9 /100 | #258 | Tragic 1.5% |
| Liberians | 0.9 /100 | #259 | Tragic 1.5% |
| Japanese | 0.9 /100 | #260 | Tragic 1.5% |
| Immigrants | Portugal | 0.8 /100 | #261 | Tragic 1.5% |
Demographics Similar to English by Doctorate Degree
In terms of doctorate degree, the demographic groups most similar to English are Albanian (1.9%, a difference of 0.19%), Basque (1.9%, a difference of 0.20%), Immigrants from Kenya (1.9%, a difference of 0.30%), Immigrants from Oceania (1.9%, a difference of 0.34%), and Immigrants from Albania (1.9%, a difference of 0.57%).
| Demographics | Rating | Rank | Doctorate Degree |
| Sierra Leoneans | 85.1 /100 | #143 | Excellent 2.0% |
| Immigrants | Moldova | 84.3 /100 | #144 | Excellent 2.0% |
| Kenyans | 83.6 /100 | #145 | Excellent 1.9% |
| Immigrants | Syria | 83.6 /100 | #146 | Excellent 1.9% |
| Immigrants | Senegal | 82.5 /100 | #147 | Excellent 1.9% |
| Luxembourgers | 81.1 /100 | #148 | Excellent 1.9% |
| Basques | 76.9 /100 | #149 | Good 1.9% |
| English | 75.9 /100 | #150 | Good 1.9% |
| Albanians | 74.8 /100 | #151 | Good 1.9% |
| Immigrants | Kenya | 74.3 /100 | #152 | Good 1.9% |
| Immigrants | Oceania | 74.0 /100 | #153 | Good 1.9% |
| Immigrants | Albania | 72.8 /100 | #154 | Good 1.9% |
| Poles | 72.7 /100 | #155 | Good 1.9% |
| Slavs | 72.4 /100 | #156 | Good 1.9% |
| Danes | 71.9 /100 | #157 | Good 1.9% |