Apache vs English Vision Disability
COMPARE
Apache
English
Vision Disability
Vision Disability Comparison
Apache
English
3.0%
VISION DISABILITY
0.0/ 100
METRIC RATING
329th/ 347
METRIC RANK
2.3%
VISION DISABILITY
1.1/ 100
METRIC RATING
239th/ 347
METRIC RANK
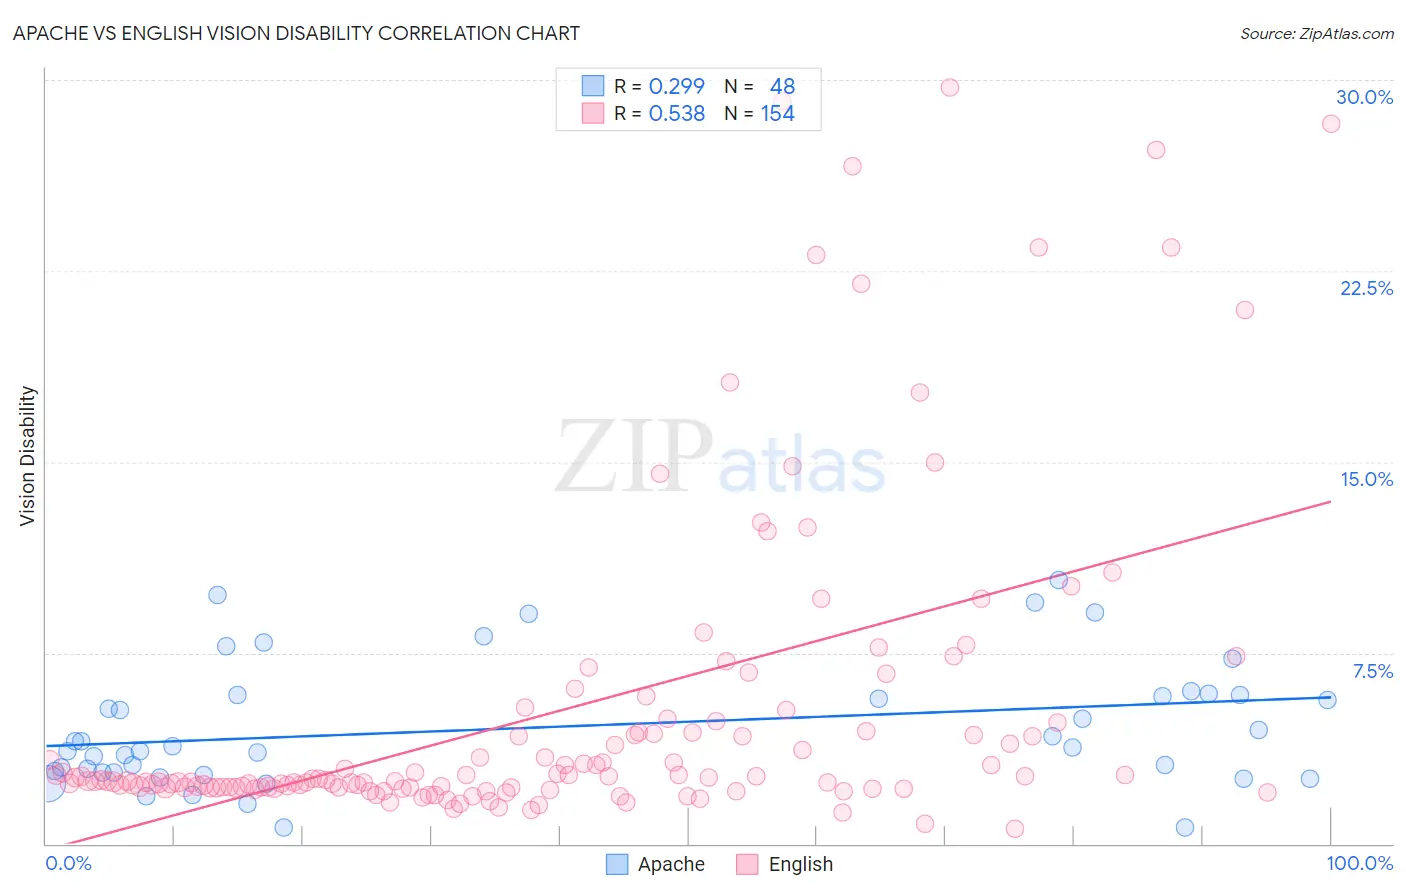
Apache vs English Vision Disability Correlation Chart
The statistical analysis conducted on geographies consisting of 231,003,425 people shows a weak positive correlation between the proportion of Apache and percentage of population with vision disability in the United States with a correlation coefficient (R) of 0.299 and weighted average of 3.0%. Similarly, the statistical analysis conducted on geographies consisting of 576,976,464 people shows a substantial positive correlation between the proportion of English and percentage of population with vision disability in the United States with a correlation coefficient (R) of 0.538 and weighted average of 2.3%, a difference of 28.9%.
Vision Disability Correlation Summary
| Measurement | Apache | English |
| Minimum | 0.65% | 0.59% |
| Maximum | 10.4% | 29.7% |
| Range | 9.7% | 29.1% |
| Mean | 4.6% | 5.2% |
| Median | 3.8% | 2.5% |
| Interquartile 25% (IQ1) | 2.8% | 2.2% |
| Interquartile 75% (IQ3) | 5.8% | 4.4% |
| Interquartile Range (IQR) | 3.0% | 2.2% |
| Standard Deviation (Sample) | 2.5% | 6.3% |
| Standard Deviation (Population) | 2.4% | 6.2% |
Similar Demographics by Vision Disability
Demographics Similar to Apache by Vision Disability
In terms of vision disability, the demographic groups most similar to Apache are Yuman (3.0%, a difference of 0.19%), Native/Alaskan (3.0%, a difference of 0.74%), Colville (3.0%, a difference of 1.2%), Spanish American (2.9%, a difference of 1.5%), and Central American Indian (3.0%, a difference of 1.8%).
| Demographics | Rating | Rank | Vision Disability |
| Paiute | 0.0 /100 | #322 | Tragic 2.9% |
| Tlingit-Haida | 0.0 /100 | #323 | Tragic 2.9% |
| Hopi | 0.0 /100 | #324 | Tragic 2.9% |
| Cherokee | 0.0 /100 | #325 | Tragic 2.9% |
| Spanish Americans | 0.0 /100 | #326 | Tragic 2.9% |
| Natives/Alaskans | 0.0 /100 | #327 | Tragic 3.0% |
| Yuman | 0.0 /100 | #328 | Tragic 3.0% |
| Apache | 0.0 /100 | #329 | Tragic 3.0% |
| Colville | 0.0 /100 | #330 | Tragic 3.0% |
| Central American Indians | 0.0 /100 | #331 | Tragic 3.0% |
| Seminole | 0.0 /100 | #332 | Tragic 3.1% |
| Cajuns | 0.0 /100 | #333 | Tragic 3.1% |
| Cheyenne | 0.0 /100 | #334 | Tragic 3.1% |
| Navajo | 0.0 /100 | #335 | Tragic 3.1% |
| Alaskan Athabascans | 0.0 /100 | #336 | Tragic 3.1% |
Demographics Similar to English by Vision Disability
In terms of vision disability, the demographic groups most similar to English are Immigrants from Cambodia (2.3%, a difference of 0.020%), Panamanian (2.3%, a difference of 0.25%), Immigrants from Portugal (2.3%, a difference of 0.29%), Malaysian (2.3%, a difference of 0.29%), and Immigrants from Congo (2.3%, a difference of 0.34%).
| Demographics | Rating | Rank | Vision Disability |
| German Russians | 1.8 /100 | #232 | Tragic 2.3% |
| Central Americans | 1.8 /100 | #233 | Tragic 2.3% |
| Scottish | 1.6 /100 | #234 | Tragic 2.3% |
| Marshallese | 1.5 /100 | #235 | Tragic 2.3% |
| Immigrants | Congo | 1.4 /100 | #236 | Tragic 2.3% |
| Immigrants | Portugal | 1.4 /100 | #237 | Tragic 2.3% |
| Immigrants | Cambodia | 1.1 /100 | #238 | Tragic 2.3% |
| English | 1.1 /100 | #239 | Tragic 2.3% |
| Panamanians | 0.9 /100 | #240 | Tragic 2.3% |
| Malaysians | 0.9 /100 | #241 | Tragic 2.3% |
| Immigrants | Panama | 0.8 /100 | #242 | Tragic 2.3% |
| Immigrants | Nicaragua | 0.6 /100 | #243 | Tragic 2.3% |
| Immigrants | West Indies | 0.6 /100 | #244 | Tragic 2.3% |
| Alsatians | 0.6 /100 | #245 | Tragic 2.3% |
| French | 0.5 /100 | #246 | Tragic 2.3% |