Lumbee vs Immigrants from Latin America High School Diploma
COMPARE
Lumbee
Immigrants from Latin America
High School Diploma
High School Diploma Comparison
Lumbee
Immigrants from Latin America
83.6%
HIGH SCHOOL DIPLOMA
0.0/ 100
METRIC RATING
322nd/ 347
METRIC RANK
82.1%
HIGH SCHOOL DIPLOMA
0.0/ 100
METRIC RATING
333rd/ 347
METRIC RANK
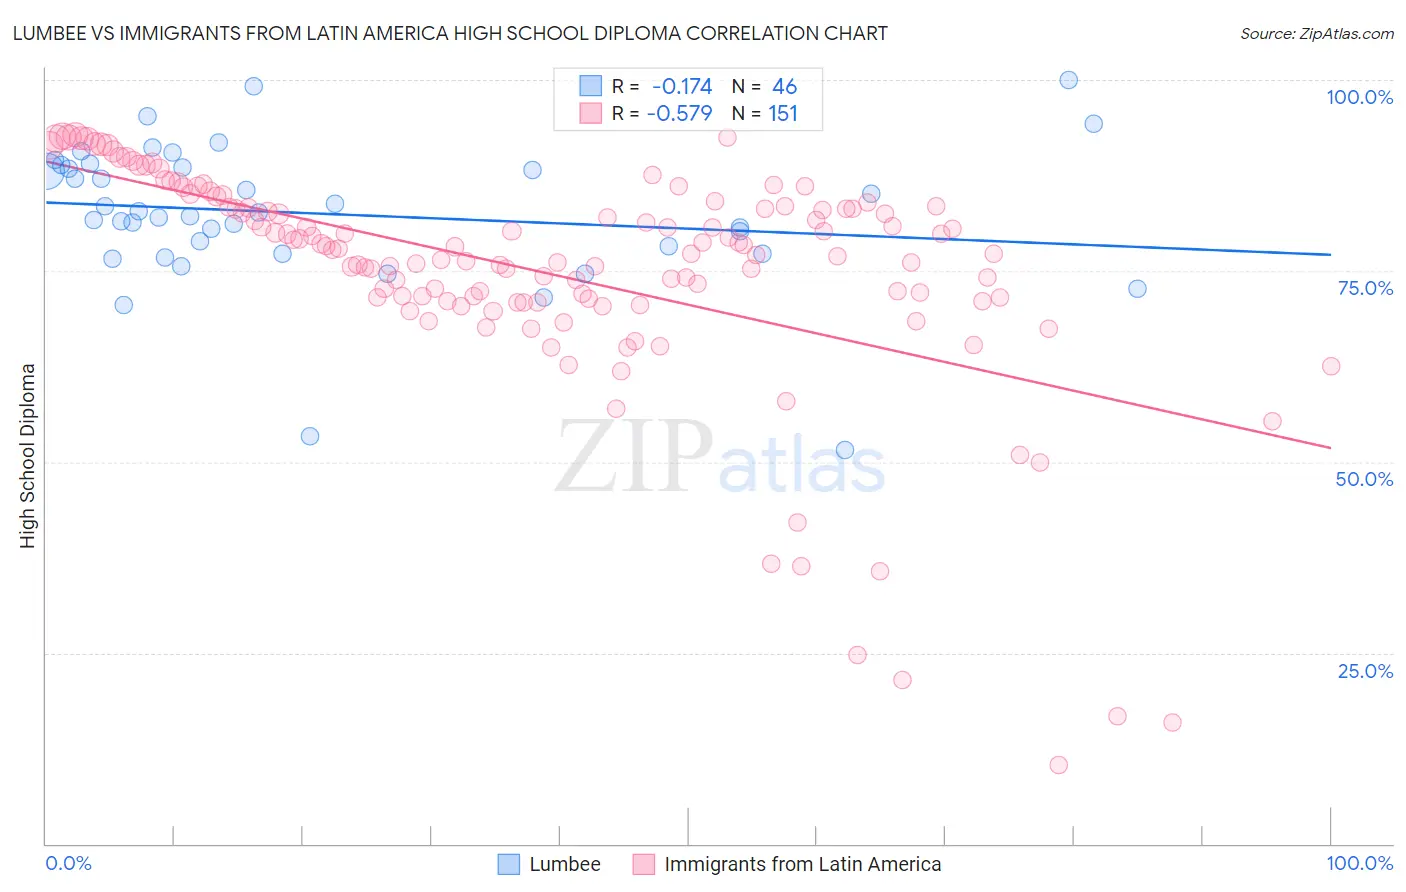
Lumbee vs Immigrants from Latin America High School Diploma Correlation Chart
The statistical analysis conducted on geographies consisting of 92,299,068 people shows a poor negative correlation between the proportion of Lumbee and percentage of population with at least high school diploma education in the United States with a correlation coefficient (R) of -0.174 and weighted average of 83.6%. Similarly, the statistical analysis conducted on geographies consisting of 558,650,507 people shows a substantial negative correlation between the proportion of Immigrants from Latin America and percentage of population with at least high school diploma education in the United States with a correlation coefficient (R) of -0.579 and weighted average of 82.1%, a difference of 1.8%.
High School Diploma Correlation Summary
| Measurement | Lumbee | Immigrants from Latin America |
| Minimum | 51.6% | 10.3% |
| Maximum | 100.0% | 92.8% |
| Range | 48.4% | 82.5% |
| Mean | 82.4% | 74.9% |
| Median | 82.4% | 77.8% |
| Interquartile 25% (IQ1) | 77.3% | 71.0% |
| Interquartile 75% (IQ3) | 88.5% | 83.4% |
| Interquartile Range (IQR) | 11.2% | 12.3% |
| Standard Deviation (Sample) | 9.4% | 15.1% |
| Standard Deviation (Population) | 9.3% | 15.0% |
Demographics Similar to Lumbee and Immigrants from Latin America by High School Diploma
In terms of high school diploma, the demographic groups most similar to Lumbee are Immigrants from Cuba (83.5%, a difference of 0.16%), Yuman (84.0%, a difference of 0.41%), Immigrants from Cabo Verde (83.3%, a difference of 0.45%), Nicaraguan (84.1%, a difference of 0.55%), and Central American Indian (84.2%, a difference of 0.64%). Similarly, the demographic groups most similar to Immigrants from Latin America are Tohono O'odham (82.1%, a difference of 0.11%), Guatemalan (82.0%, a difference of 0.22%), Immigrants from Dominican Republic (82.0%, a difference of 0.23%), Immigrants from Yemen (81.8%, a difference of 0.37%), and Immigrants from Honduras (82.5%, a difference of 0.39%).
| Demographics | Rating | Rank | High School Diploma |
| Immigrants | Caribbean | 0.0 /100 | #317 | Tragic 84.3% |
| Immigrants | Belize | 0.0 /100 | #318 | Tragic 84.2% |
| Central American Indians | 0.0 /100 | #319 | Tragic 84.2% |
| Nicaraguans | 0.0 /100 | #320 | Tragic 84.1% |
| Yuman | 0.0 /100 | #321 | Tragic 84.0% |
| Lumbee | 0.0 /100 | #322 | Tragic 83.6% |
| Immigrants | Cuba | 0.0 /100 | #323 | Tragic 83.5% |
| Immigrants | Cabo Verde | 0.0 /100 | #324 | Tragic 83.3% |
| Immigrants | Nicaragua | 0.0 /100 | #325 | Tragic 83.1% |
| Mexican American Indians | 0.0 /100 | #326 | Tragic 83.0% |
| Hondurans | 0.0 /100 | #327 | Tragic 83.0% |
| Dominicans | 0.0 /100 | #328 | Tragic 82.9% |
| Hispanics or Latinos | 0.0 /100 | #329 | Tragic 82.9% |
| Immigrants | Azores | 0.0 /100 | #330 | Tragic 82.8% |
| Central Americans | 0.0 /100 | #331 | Tragic 82.5% |
| Immigrants | Honduras | 0.0 /100 | #332 | Tragic 82.5% |
| Immigrants | Latin America | 0.0 /100 | #333 | Tragic 82.1% |
| Tohono O'odham | 0.0 /100 | #334 | Tragic 82.1% |
| Guatemalans | 0.0 /100 | #335 | Tragic 82.0% |
| Immigrants | Dominican Republic | 0.0 /100 | #336 | Tragic 82.0% |
| Immigrants | Yemen | 0.0 /100 | #337 | Tragic 81.8% |