Alsatian vs Immigrants from North America Master's Degree
COMPARE
Alsatian
Immigrants from North America
Master's Degree
Master's Degree Comparison
Alsatians
Immigrants from North America
16.9%
MASTER'S DEGREE
98.4/ 100
METRIC RATING
103rd/ 347
METRIC RANK
17.2%
MASTER'S DEGREE
99.1/ 100
METRIC RATING
92nd/ 347
METRIC RANK
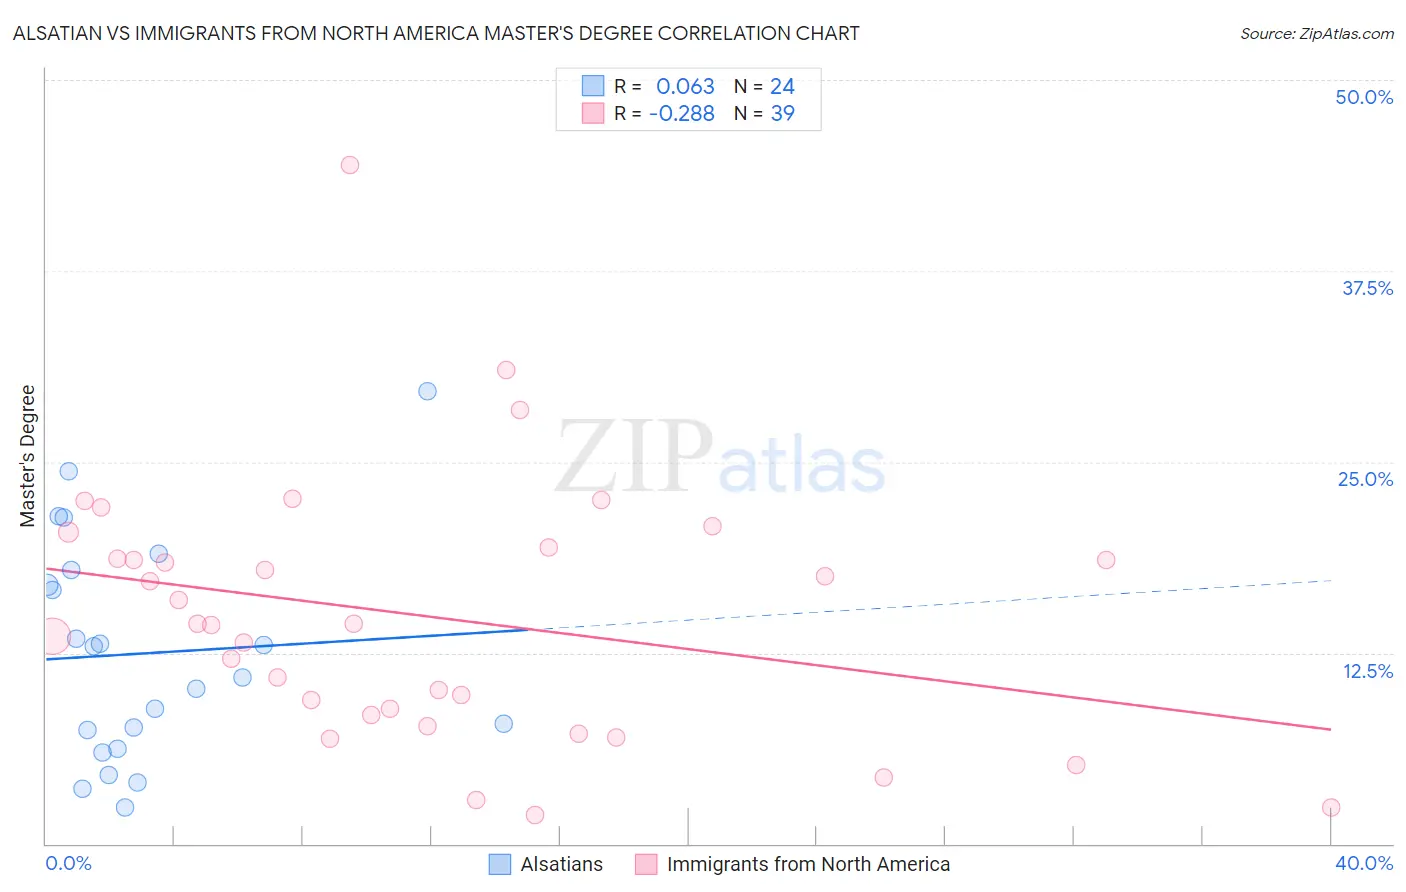
Alsatian vs Immigrants from North America Master's Degree Correlation Chart
The statistical analysis conducted on geographies consisting of 82,679,386 people shows a slight positive correlation between the proportion of Alsatians and percentage of population with at least master's degree education in the United States with a correlation coefficient (R) of 0.063 and weighted average of 16.9%. Similarly, the statistical analysis conducted on geographies consisting of 462,287,354 people shows a weak negative correlation between the proportion of Immigrants from North America and percentage of population with at least master's degree education in the United States with a correlation coefficient (R) of -0.288 and weighted average of 17.2%, a difference of 1.7%.
Master's Degree Correlation Summary
| Measurement | Alsatian | Immigrants from North America |
| Minimum | 2.4% | 1.9% |
| Maximum | 29.7% | 44.5% |
| Range | 27.3% | 42.5% |
| Mean | 12.5% | 14.9% |
| Median | 11.9% | 14.4% |
| Interquartile 25% (IQ1) | 6.8% | 8.4% |
| Interquartile 75% (IQ3) | 17.4% | 19.4% |
| Interquartile Range (IQR) | 10.6% | 11.0% |
| Standard Deviation (Sample) | 7.2% | 8.6% |
| Standard Deviation (Population) | 7.1% | 8.5% |
Demographics Similar to Alsatians and Immigrants from North America by Master's Degree
In terms of master's degree, the demographic groups most similar to Alsatians are Ukrainian (16.9%, a difference of 0.12%), Syrian (16.8%, a difference of 0.22%), Chilean (16.9%, a difference of 0.33%), Immigrants from Nepal (17.0%, a difference of 0.41%), and Immigrants from Albania (16.8%, a difference of 0.50%). Similarly, the demographic groups most similar to Immigrants from North America are Romanian (17.2%, a difference of 0.050%), Immigrants from Italy (17.2%, a difference of 0.060%), Immigrants from Egypt (17.2%, a difference of 0.12%), Bhutanese (17.2%, a difference of 0.14%), and Ugandan (17.1%, a difference of 0.19%).
| Demographics | Rating | Rank | Master's Degree |
| Maltese | 99.3 /100 | #87 | Exceptional 17.3% |
| Immigrants | Canada | 99.2 /100 | #88 | Exceptional 17.2% |
| Bhutanese | 99.1 /100 | #89 | Exceptional 17.2% |
| Immigrants | Egypt | 99.1 /100 | #90 | Exceptional 17.2% |
| Romanians | 99.1 /100 | #91 | Exceptional 17.2% |
| Immigrants | North America | 99.1 /100 | #92 | Exceptional 17.2% |
| Immigrants | Italy | 99.1 /100 | #93 | Exceptional 17.2% |
| Ugandans | 99.0 /100 | #94 | Exceptional 17.1% |
| Immigrants | Morocco | 98.9 /100 | #95 | Exceptional 17.1% |
| Immigrants | Northern Africa | 98.9 /100 | #96 | Exceptional 17.1% |
| Immigrants | England | 98.8 /100 | #97 | Exceptional 17.0% |
| Immigrants | Ukraine | 98.8 /100 | #98 | Exceptional 17.0% |
| Laotians | 98.8 /100 | #99 | Exceptional 17.0% |
| Albanians | 98.7 /100 | #100 | Exceptional 17.0% |
| Immigrants | Nepal | 98.6 /100 | #101 | Exceptional 17.0% |
| Chileans | 98.6 /100 | #102 | Exceptional 16.9% |
| Alsatians | 98.4 /100 | #103 | Exceptional 16.9% |
| Ukrainians | 98.3 /100 | #104 | Exceptional 16.9% |
| Syrians | 98.3 /100 | #105 | Exceptional 16.8% |
| Immigrants | Albania | 98.1 /100 | #106 | Exceptional 16.8% |
| Armenians | 98.0 /100 | #107 | Exceptional 16.8% |