Alsatian vs Immigrants from Sri Lanka Master's Degree
COMPARE
Alsatian
Immigrants from Sri Lanka
Master's Degree
Master's Degree Comparison
Alsatians
Immigrants from Sri Lanka
16.9%
MASTER'S DEGREE
98.4/ 100
METRIC RATING
103rd/ 347
METRIC RANK
19.9%
MASTER'S DEGREE
100.0/ 100
METRIC RATING
27th/ 347
METRIC RANK
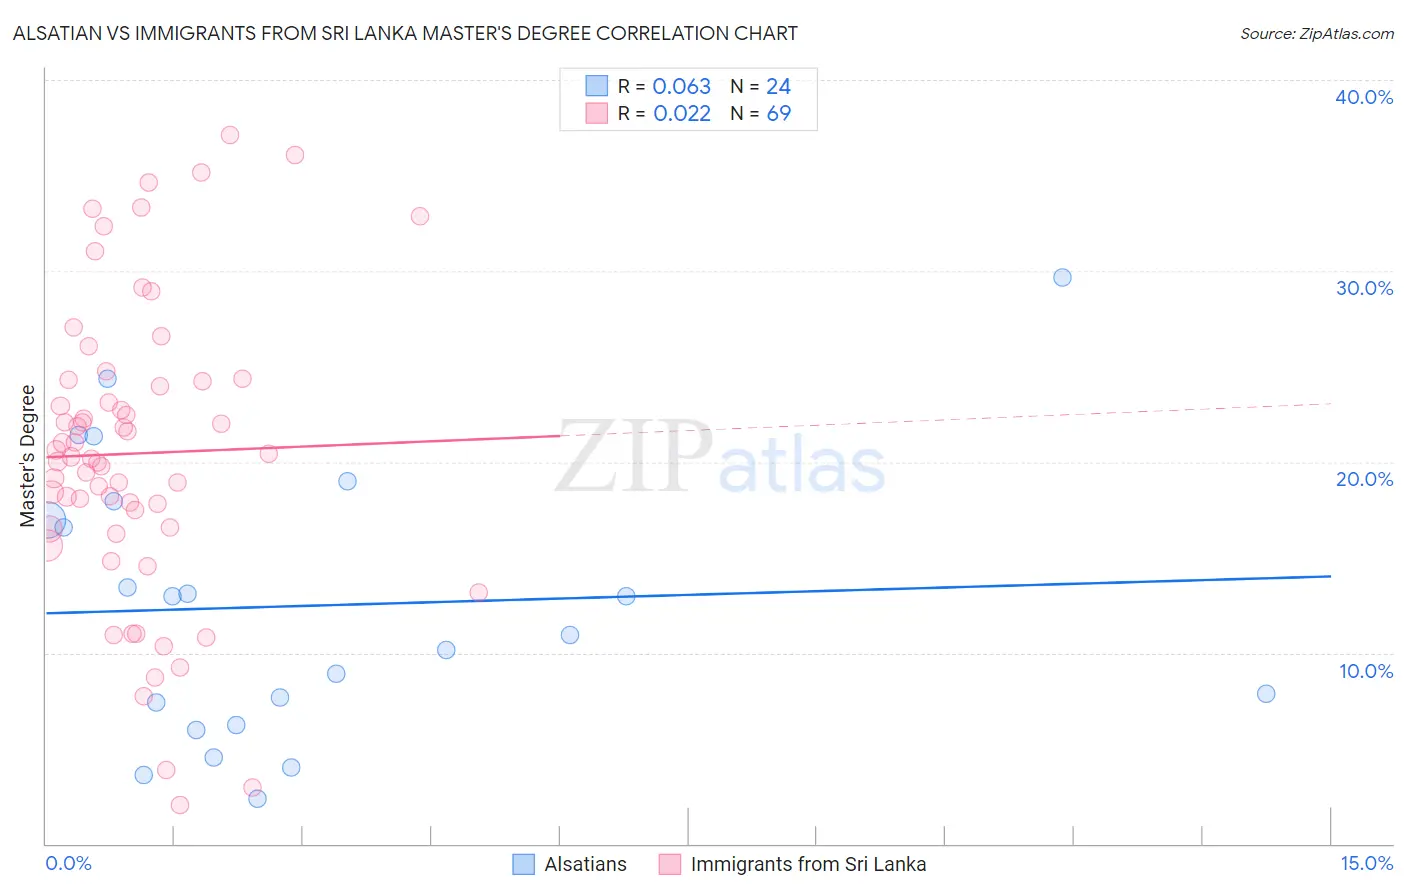
Alsatian vs Immigrants from Sri Lanka Master's Degree Correlation Chart
The statistical analysis conducted on geographies consisting of 82,679,386 people shows a slight positive correlation between the proportion of Alsatians and percentage of population with at least master's degree education in the United States with a correlation coefficient (R) of 0.063 and weighted average of 16.9%. Similarly, the statistical analysis conducted on geographies consisting of 149,694,773 people shows no correlation between the proportion of Immigrants from Sri Lanka and percentage of population with at least master's degree education in the United States with a correlation coefficient (R) of 0.022 and weighted average of 19.9%, a difference of 17.9%.
Master's Degree Correlation Summary
| Measurement | Alsatian | Immigrants from Sri Lanka |
| Minimum | 2.4% | 2.0% |
| Maximum | 29.7% | 37.1% |
| Range | 27.3% | 35.1% |
| Mean | 12.5% | 20.4% |
| Median | 11.9% | 20.3% |
| Interquartile 25% (IQ1) | 6.8% | 16.5% |
| Interquartile 75% (IQ3) | 17.4% | 24.3% |
| Interquartile Range (IQR) | 10.6% | 7.7% |
| Standard Deviation (Sample) | 7.2% | 7.8% |
| Standard Deviation (Population) | 7.1% | 7.7% |
Similar Demographics by Master's Degree
Demographics Similar to Alsatians by Master's Degree
In terms of master's degree, the demographic groups most similar to Alsatians are Ukrainian (16.9%, a difference of 0.12%), Syrian (16.8%, a difference of 0.22%), Chilean (16.9%, a difference of 0.33%), Immigrants from Nepal (17.0%, a difference of 0.41%), and Immigrants from Albania (16.8%, a difference of 0.50%).
| Demographics | Rating | Rank | Master's Degree |
| Immigrants | Northern Africa | 98.9 /100 | #96 | Exceptional 17.1% |
| Immigrants | England | 98.8 /100 | #97 | Exceptional 17.0% |
| Immigrants | Ukraine | 98.8 /100 | #98 | Exceptional 17.0% |
| Laotians | 98.8 /100 | #99 | Exceptional 17.0% |
| Albanians | 98.7 /100 | #100 | Exceptional 17.0% |
| Immigrants | Nepal | 98.6 /100 | #101 | Exceptional 17.0% |
| Chileans | 98.6 /100 | #102 | Exceptional 16.9% |
| Alsatians | 98.4 /100 | #103 | Exceptional 16.9% |
| Ukrainians | 98.3 /100 | #104 | Exceptional 16.9% |
| Syrians | 98.3 /100 | #105 | Exceptional 16.8% |
| Immigrants | Albania | 98.1 /100 | #106 | Exceptional 16.8% |
| Armenians | 98.0 /100 | #107 | Exceptional 16.8% |
| Sierra Leoneans | 98.0 /100 | #108 | Exceptional 16.8% |
| Moroccans | 98.0 /100 | #109 | Exceptional 16.8% |
| Immigrants | Chile | 98.0 /100 | #110 | Exceptional 16.8% |
Demographics Similar to Immigrants from Sri Lanka by Master's Degree
In terms of master's degree, the demographic groups most similar to Immigrants from Sri Lanka are Turkish (19.9%, a difference of 0.070%), Cambodian (20.0%, a difference of 0.41%), Latvian (19.8%, a difference of 0.48%), Immigrants from Japan (20.0%, a difference of 0.51%), and Immigrants from Turkey (19.7%, a difference of 0.99%).
| Demographics | Rating | Rank | Master's Degree |
| Indians (Asian) | 100.0 /100 | #20 | Exceptional 20.5% |
| Immigrants | Ireland | 100.0 /100 | #21 | Exceptional 20.4% |
| Israelis | 100.0 /100 | #22 | Exceptional 20.3% |
| Immigrants | France | 100.0 /100 | #23 | Exceptional 20.3% |
| Immigrants | Sweden | 100.0 /100 | #24 | Exceptional 20.3% |
| Immigrants | Japan | 100.0 /100 | #25 | Exceptional 20.0% |
| Cambodians | 100.0 /100 | #26 | Exceptional 20.0% |
| Immigrants | Sri Lanka | 100.0 /100 | #27 | Exceptional 19.9% |
| Turks | 100.0 /100 | #28 | Exceptional 19.9% |
| Latvians | 100.0 /100 | #29 | Exceptional 19.8% |
| Immigrants | Turkey | 100.0 /100 | #30 | Exceptional 19.7% |
| Immigrants | Korea | 100.0 /100 | #31 | Exceptional 19.7% |
| Burmese | 100.0 /100 | #32 | Exceptional 19.7% |
| Russians | 100.0 /100 | #33 | Exceptional 19.5% |
| Immigrants | Denmark | 100.0 /100 | #34 | Exceptional 19.5% |