Alsatian vs U.S. Virgin Islander 11th Grade
COMPARE
Alsatian
U.S. Virgin Islander
11th Grade
11th Grade Comparison
Alsatians
U.S. Virgin Islanders
92.6%
11TH GRADE
60.2/ 100
METRIC RATING
167th/ 347
METRIC RANK
91.1%
11TH GRADE
0.2/ 100
METRIC RATING
268th/ 347
METRIC RANK
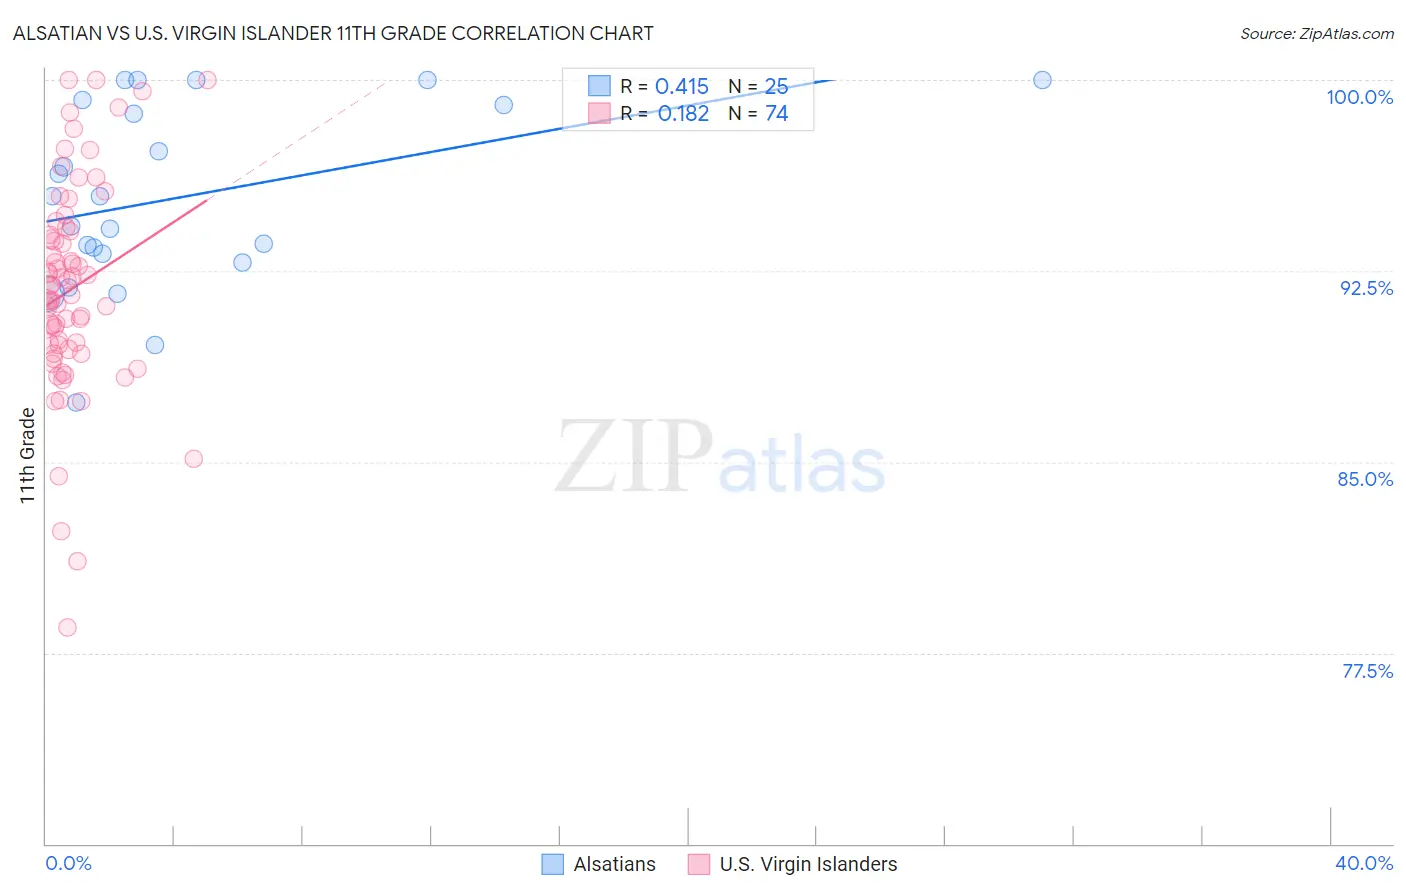
Alsatian vs U.S. Virgin Islander 11th Grade Correlation Chart
The statistical analysis conducted on geographies consisting of 82,682,365 people shows a moderate positive correlation between the proportion of Alsatians and percentage of population with at least 11th grade education in the United States with a correlation coefficient (R) of 0.415 and weighted average of 92.6%. Similarly, the statistical analysis conducted on geographies consisting of 87,529,315 people shows a poor positive correlation between the proportion of U.S. Virgin Islanders and percentage of population with at least 11th grade education in the United States with a correlation coefficient (R) of 0.182 and weighted average of 91.1%, a difference of 1.7%.
11th Grade Correlation Summary
| Measurement | Alsatian | U.S. Virgin Islander |
| Minimum | 87.3% | 78.5% |
| Maximum | 100.0% | 100.0% |
| Range | 12.7% | 21.5% |
| Mean | 95.4% | 91.8% |
| Median | 95.4% | 91.7% |
| Interquartile 25% (IQ1) | 93.0% | 89.4% |
| Interquartile 75% (IQ3) | 99.1% | 94.1% |
| Interquartile Range (IQR) | 6.1% | 4.7% |
| Standard Deviation (Sample) | 3.6% | 4.2% |
| Standard Deviation (Population) | 3.6% | 4.2% |
Similar Demographics by 11th Grade
Demographics Similar to Alsatians by 11th Grade
In terms of 11th grade, the demographic groups most similar to Alsatians are Bermudan (92.6%, a difference of 0.020%), Sierra Leonean (92.6%, a difference of 0.020%), Immigrants from Albania (92.6%, a difference of 0.020%), Immigrants from Northern Africa (92.6%, a difference of 0.030%), and Immigrants from Iraq (92.6%, a difference of 0.040%).
| Demographics | Rating | Rank | 11th Grade |
| Immigrants | Lebanon | 70.7 /100 | #160 | Good 92.7% |
| Immigrants | Argentina | 69.8 /100 | #161 | Good 92.7% |
| Paraguayans | 68.7 /100 | #162 | Good 92.7% |
| Immigrants | Nonimmigrants | 66.6 /100 | #163 | Good 92.7% |
| Spanish | 66.2 /100 | #164 | Good 92.7% |
| Immigrants | Iraq | 63.7 /100 | #165 | Good 92.6% |
| Bermudans | 62.3 /100 | #166 | Good 92.6% |
| Alsatians | 60.2 /100 | #167 | Good 92.6% |
| Sierra Leoneans | 58.7 /100 | #168 | Average 92.6% |
| Immigrants | Albania | 57.8 /100 | #169 | Average 92.6% |
| Immigrants | Northern Africa | 57.3 /100 | #170 | Average 92.6% |
| Laotians | 54.4 /100 | #171 | Average 92.6% |
| Immigrants | Pakistan | 52.3 /100 | #172 | Average 92.5% |
| Indians (Asian) | 51.5 /100 | #173 | Average 92.5% |
| Asians | 50.0 /100 | #174 | Average 92.5% |
Demographics Similar to U.S. Virgin Islanders by 11th Grade
In terms of 11th grade, the demographic groups most similar to U.S. Virgin Islanders are Ute (91.1%, a difference of 0.030%), Trinidadian and Tobagonian (91.1%, a difference of 0.060%), Immigrants from Jamaica (91.2%, a difference of 0.070%), Immigrants from Western Africa (91.2%, a difference of 0.080%), and Immigrants from Peru (91.0%, a difference of 0.090%).
| Demographics | Rating | Rank | 11th Grade |
| Taiwanese | 0.6 /100 | #261 | Tragic 91.3% |
| Immigrants | Uruguay | 0.5 /100 | #262 | Tragic 91.3% |
| Immigrants | Ghana | 0.3 /100 | #263 | Tragic 91.2% |
| Yup'ik | 0.3 /100 | #264 | Tragic 91.2% |
| Pueblo | 0.3 /100 | #265 | Tragic 91.2% |
| Immigrants | Western Africa | 0.3 /100 | #266 | Tragic 91.2% |
| Immigrants | Jamaica | 0.3 /100 | #267 | Tragic 91.2% |
| U.S. Virgin Islanders | 0.2 /100 | #268 | Tragic 91.1% |
| Ute | 0.2 /100 | #269 | Tragic 91.1% |
| Trinidadians and Tobagonians | 0.2 /100 | #270 | Tragic 91.1% |
| Immigrants | Peru | 0.1 /100 | #271 | Tragic 91.0% |
| West Indians | 0.1 /100 | #272 | Tragic 91.0% |
| Paiute | 0.1 /100 | #273 | Tragic 91.0% |
| Immigrants | Trinidad and Tobago | 0.1 /100 | #274 | Tragic 90.9% |
| Immigrants | South Eastern Asia | 0.1 /100 | #275 | Tragic 90.9% |