Alsatian vs Immigrants from Belize 11th Grade
COMPARE
Alsatian
Immigrants from Belize
11th Grade
11th Grade Comparison
Alsatians
Immigrants from Belize
92.6%
11TH GRADE
60.2/ 100
METRIC RATING
167th/ 347
METRIC RANK
88.7%
11TH GRADE
0.0/ 100
METRIC RATING
321st/ 347
METRIC RANK
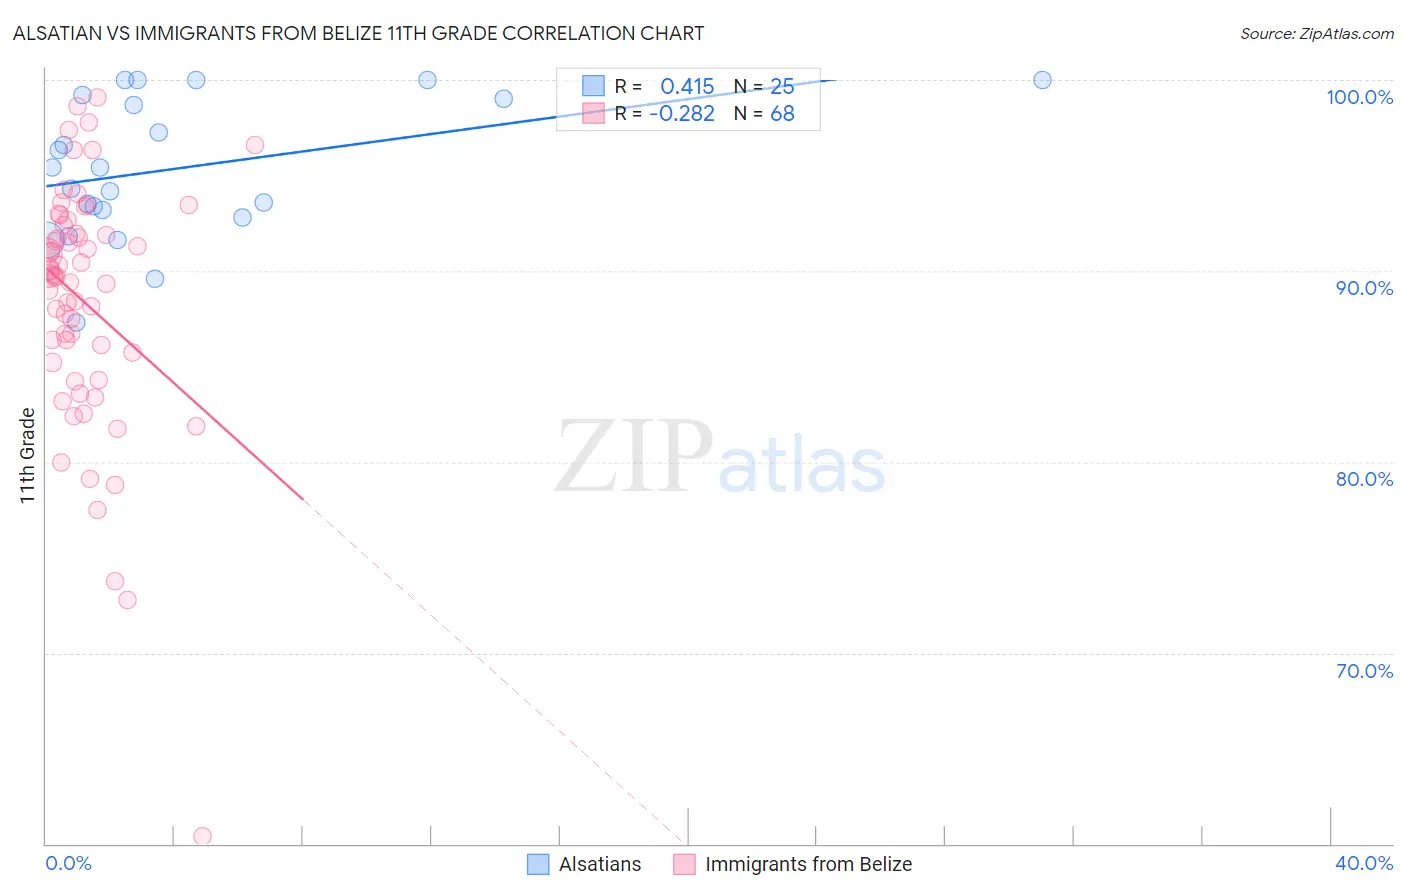
Alsatian vs Immigrants from Belize 11th Grade Correlation Chart
The statistical analysis conducted on geographies consisting of 82,682,365 people shows a moderate positive correlation between the proportion of Alsatians and percentage of population with at least 11th grade education in the United States with a correlation coefficient (R) of 0.415 and weighted average of 92.6%. Similarly, the statistical analysis conducted on geographies consisting of 130,181,087 people shows a weak negative correlation between the proportion of Immigrants from Belize and percentage of population with at least 11th grade education in the United States with a correlation coefficient (R) of -0.282 and weighted average of 88.7%, a difference of 4.4%.
11th Grade Correlation Summary
| Measurement | Alsatian | Immigrants from Belize |
| Minimum | 87.3% | 60.4% |
| Maximum | 100.0% | 99.1% |
| Range | 12.7% | 38.7% |
| Mean | 95.4% | 88.4% |
| Median | 95.4% | 89.7% |
| Interquartile 25% (IQ1) | 93.0% | 85.5% |
| Interquartile 75% (IQ3) | 99.1% | 92.2% |
| Interquartile Range (IQR) | 6.1% | 6.7% |
| Standard Deviation (Sample) | 3.6% | 6.5% |
| Standard Deviation (Population) | 3.6% | 6.5% |
Similar Demographics by 11th Grade
Demographics Similar to Alsatians by 11th Grade
In terms of 11th grade, the demographic groups most similar to Alsatians are Bermudan (92.6%, a difference of 0.020%), Sierra Leonean (92.6%, a difference of 0.020%), Immigrants from Albania (92.6%, a difference of 0.020%), Immigrants from Northern Africa (92.6%, a difference of 0.030%), and Immigrants from Iraq (92.6%, a difference of 0.040%).
| Demographics | Rating | Rank | 11th Grade |
| Immigrants | Lebanon | 70.7 /100 | #160 | Good 92.7% |
| Immigrants | Argentina | 69.8 /100 | #161 | Good 92.7% |
| Paraguayans | 68.7 /100 | #162 | Good 92.7% |
| Immigrants | Nonimmigrants | 66.6 /100 | #163 | Good 92.7% |
| Spanish | 66.2 /100 | #164 | Good 92.7% |
| Immigrants | Iraq | 63.7 /100 | #165 | Good 92.6% |
| Bermudans | 62.3 /100 | #166 | Good 92.6% |
| Alsatians | 60.2 /100 | #167 | Good 92.6% |
| Sierra Leoneans | 58.7 /100 | #168 | Average 92.6% |
| Immigrants | Albania | 57.8 /100 | #169 | Average 92.6% |
| Immigrants | Northern Africa | 57.3 /100 | #170 | Average 92.6% |
| Laotians | 54.4 /100 | #171 | Average 92.6% |
| Immigrants | Pakistan | 52.3 /100 | #172 | Average 92.5% |
| Indians (Asian) | 51.5 /100 | #173 | Average 92.5% |
| Asians | 50.0 /100 | #174 | Average 92.5% |
Demographics Similar to Immigrants from Belize by 11th Grade
In terms of 11th grade, the demographic groups most similar to Immigrants from Belize are Immigrants from Armenia (88.8%, a difference of 0.090%), Belizean (88.8%, a difference of 0.11%), Nicaraguan (88.9%, a difference of 0.20%), Lumbee (88.9%, a difference of 0.26%), and Immigrants from Cuba (88.9%, a difference of 0.27%).
| Demographics | Rating | Rank | 11th Grade |
| Cape Verdeans | 0.0 /100 | #314 | Tragic 89.1% |
| Immigrants | Ecuador | 0.0 /100 | #315 | Tragic 89.1% |
| Immigrants | Cuba | 0.0 /100 | #316 | Tragic 88.9% |
| Lumbee | 0.0 /100 | #317 | Tragic 88.9% |
| Nicaraguans | 0.0 /100 | #318 | Tragic 88.9% |
| Belizeans | 0.0 /100 | #319 | Tragic 88.8% |
| Immigrants | Armenia | 0.0 /100 | #320 | Tragic 88.8% |
| Immigrants | Belize | 0.0 /100 | #321 | Tragic 88.7% |
| Puerto Ricans | 0.0 /100 | #322 | Tragic 88.4% |
| Pima | 0.0 /100 | #323 | Tragic 88.3% |
| Central American Indians | 0.0 /100 | #324 | Tragic 88.2% |
| Immigrants | Nicaragua | 0.0 /100 | #325 | Tragic 88.1% |
| Dominicans | 0.0 /100 | #326 | Tragic 87.7% |
| Immigrants | Cabo Verde | 0.0 /100 | #327 | Tragic 87.6% |
| Tohono O'odham | 0.0 /100 | #328 | Tragic 87.6% |