Israeli vs African 10th Grade
COMPARE
Israeli
African
10th Grade
10th Grade Comparison
Israelis
Africans
94.3%
10TH GRADE
93.8/ 100
METRIC RATING
127th/ 347
METRIC RANK
93.1%
10TH GRADE
4.6/ 100
METRIC RATING
235th/ 347
METRIC RANK
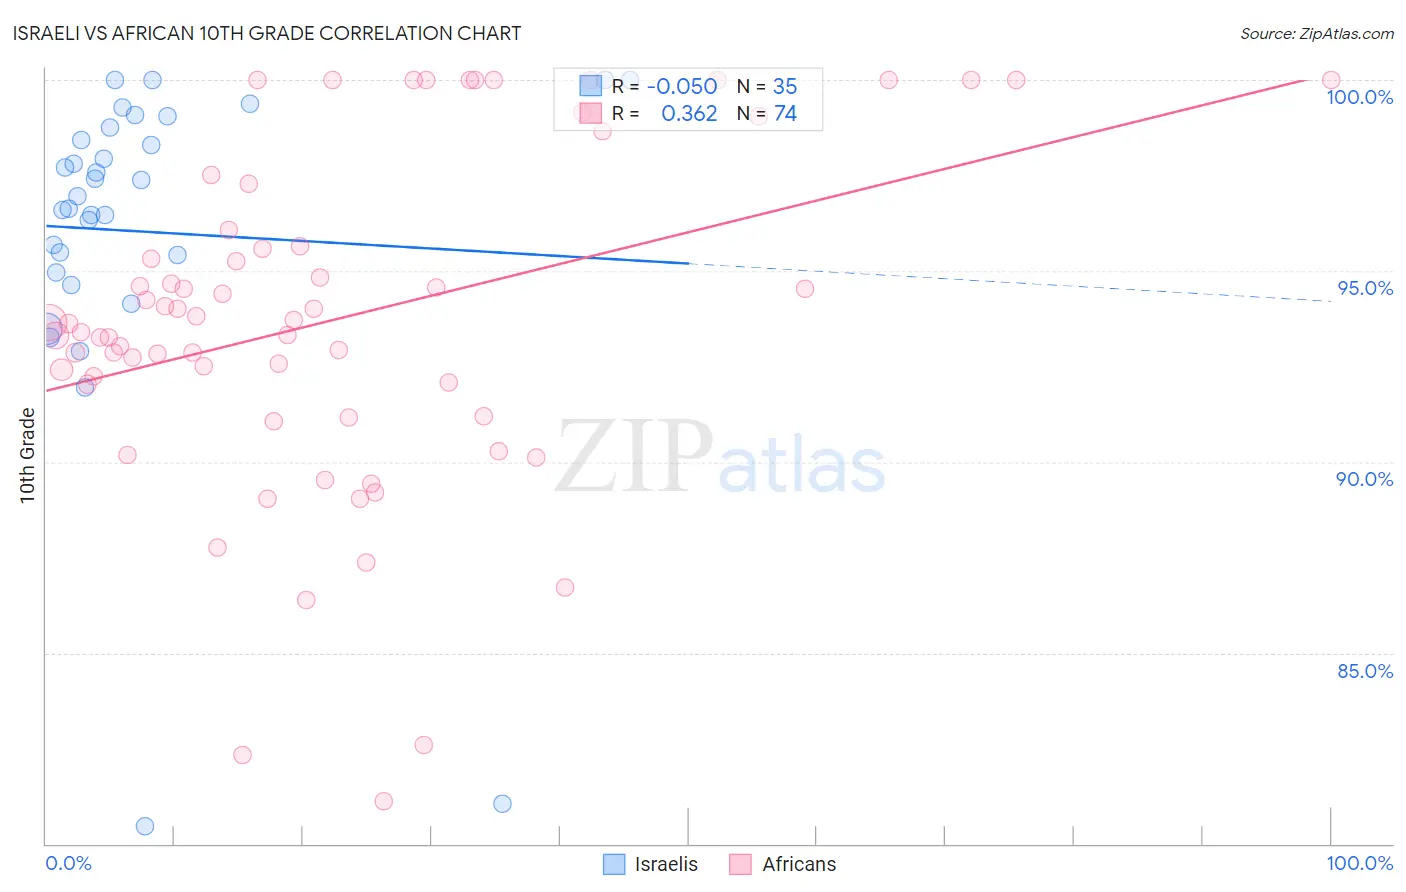
Israeli vs African 10th Grade Correlation Chart
The statistical analysis conducted on geographies consisting of 211,220,151 people shows no correlation between the proportion of Israelis and percentage of population with at least 10th grade education in the United States with a correlation coefficient (R) of -0.050 and weighted average of 94.3%. Similarly, the statistical analysis conducted on geographies consisting of 470,094,658 people shows a mild positive correlation between the proportion of Africans and percentage of population with at least 10th grade education in the United States with a correlation coefficient (R) of 0.362 and weighted average of 93.1%, a difference of 1.3%.
10th Grade Correlation Summary
| Measurement | Israeli | African |
| Minimum | 80.4% | 81.1% |
| Maximum | 100.0% | 100.0% |
| Range | 19.6% | 18.9% |
| Mean | 96.0% | 93.8% |
| Median | 97.0% | 93.6% |
| Interquartile 25% (IQ1) | 95.0% | 92.0% |
| Interquartile 75% (IQ3) | 98.8% | 96.1% |
| Interquartile Range (IQR) | 3.8% | 4.0% |
| Standard Deviation (Sample) | 4.4% | 4.4% |
| Standard Deviation (Population) | 4.3% | 4.4% |
Similar Demographics by 10th Grade
Demographics Similar to Israelis by 10th Grade
In terms of 10th grade, the demographic groups most similar to Israelis are Potawatomi (94.3%, a difference of 0.010%), American (94.3%, a difference of 0.020%), Immigrants from Iran (94.3%, a difference of 0.020%), Basque (94.3%, a difference of 0.040%), and Iroquois (94.3%, a difference of 0.040%).
| Demographics | Rating | Rank | 10th Grade |
| Immigrants | Taiwan | 95.3 /100 | #120 | Exceptional 94.4% |
| Immigrants | Belarus | 95.2 /100 | #121 | Exceptional 94.4% |
| Inupiat | 95.1 /100 | #122 | Exceptional 94.4% |
| Cree | 95.1 /100 | #123 | Exceptional 94.4% |
| Basques | 94.9 /100 | #124 | Exceptional 94.3% |
| Americans | 94.4 /100 | #125 | Exceptional 94.3% |
| Immigrants | Iran | 94.4 /100 | #126 | Exceptional 94.3% |
| Israelis | 93.8 /100 | #127 | Exceptional 94.3% |
| Potawatomi | 93.6 /100 | #128 | Exceptional 94.3% |
| Iroquois | 92.8 /100 | #129 | Exceptional 94.3% |
| Immigrants | Greece | 92.7 /100 | #130 | Exceptional 94.3% |
| Immigrants | Eastern Europe | 92.5 /100 | #131 | Exceptional 94.3% |
| Immigrants | Russia | 92.4 /100 | #132 | Exceptional 94.3% |
| Creek | 91.9 /100 | #133 | Exceptional 94.2% |
| Osage | 91.7 /100 | #134 | Exceptional 94.2% |
Demographics Similar to Africans by 10th Grade
In terms of 10th grade, the demographic groups most similar to Africans are Afghan (93.1%, a difference of 0.0%), South American Indian (93.1%, a difference of 0.010%), Bahamian (93.1%, a difference of 0.010%), Comanche (93.1%, a difference of 0.010%), and Subsaharan African (93.1%, a difference of 0.010%).
| Demographics | Rating | Rank | 10th Grade |
| Immigrants | China | 5.9 /100 | #228 | Tragic 93.2% |
| Immigrants | Ethiopia | 5.1 /100 | #229 | Tragic 93.1% |
| Immigrants | Africa | 5.0 /100 | #230 | Tragic 93.1% |
| South American Indians | 4.9 /100 | #231 | Tragic 93.1% |
| Bahamians | 4.9 /100 | #232 | Tragic 93.1% |
| Comanche | 4.9 /100 | #233 | Tragic 93.1% |
| Sub-Saharan Africans | 4.7 /100 | #234 | Tragic 93.1% |
| Africans | 4.6 /100 | #235 | Tragic 93.1% |
| Afghans | 4.5 /100 | #236 | Tragic 93.1% |
| Immigrants | Panama | 4.3 /100 | #237 | Tragic 93.1% |
| Nigerians | 4.2 /100 | #238 | Tragic 93.1% |
| Costa Ricans | 4.2 /100 | #239 | Tragic 93.1% |
| Immigrants | Hong Kong | 4.2 /100 | #240 | Tragic 93.1% |
| Immigrants | Somalia | 2.7 /100 | #241 | Tragic 93.0% |
| Immigrants | Cameroon | 2.6 /100 | #242 | Tragic 93.0% |