Aleut vs Immigrants from Zimbabwe Doctorate Degree
COMPARE
Aleut
Immigrants from Zimbabwe
Doctorate Degree
Doctorate Degree Comparison
Aleuts
Immigrants from Zimbabwe
1.5%
DOCTORATE DEGREE
0.4/ 100
METRIC RATING
275th/ 347
METRIC RANK
2.2%
DOCTORATE DEGREE
99.4/ 100
METRIC RATING
87th/ 347
METRIC RANK
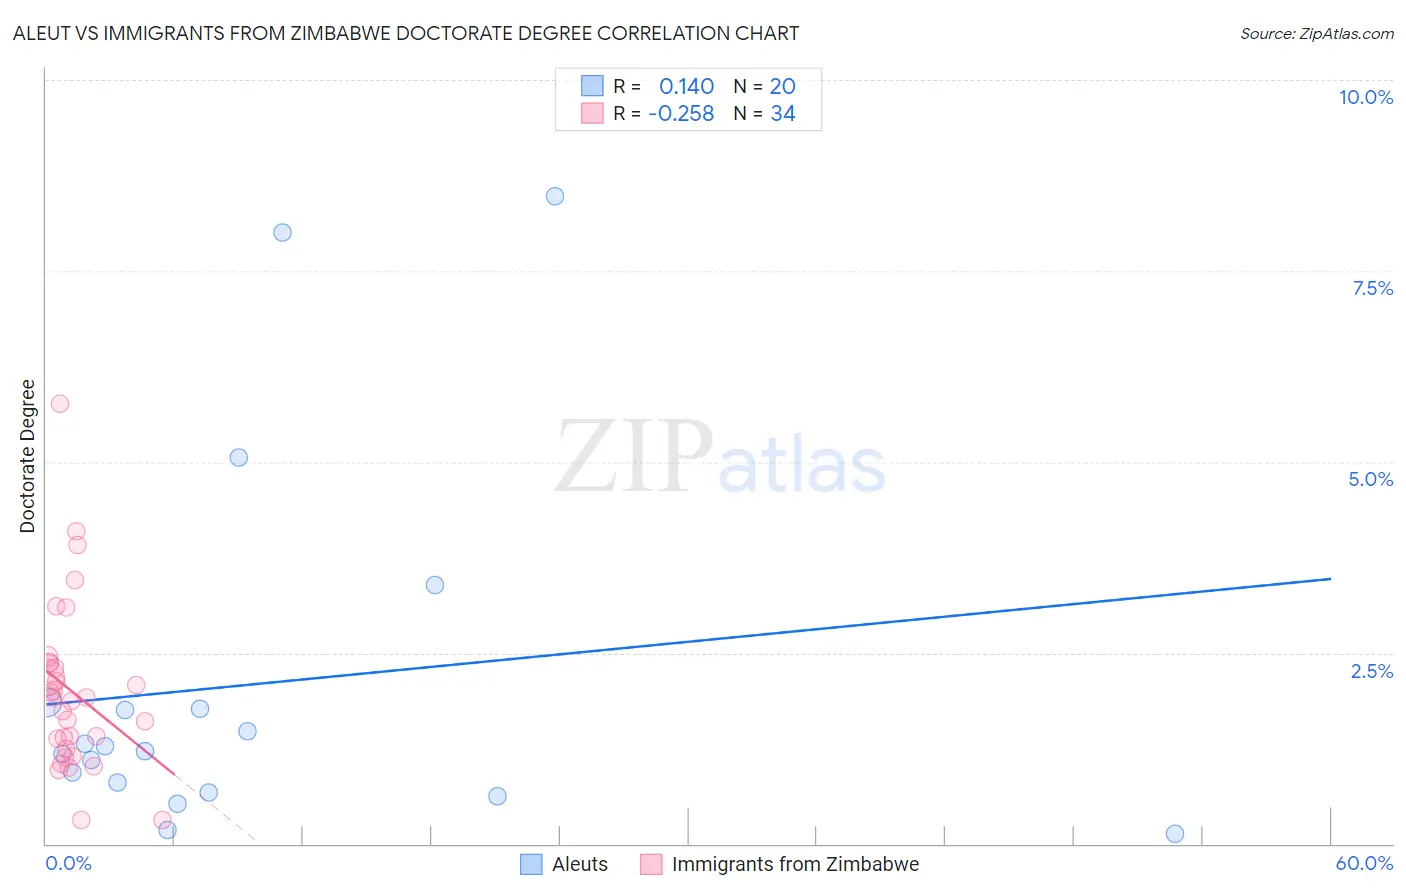
Aleut vs Immigrants from Zimbabwe Doctorate Degree Correlation Chart
The statistical analysis conducted on geographies consisting of 61,540,256 people shows a poor positive correlation between the proportion of Aleuts and percentage of population with at least doctorate degree education in the United States with a correlation coefficient (R) of 0.140 and weighted average of 1.5%. Similarly, the statistical analysis conducted on geographies consisting of 117,524,590 people shows a weak negative correlation between the proportion of Immigrants from Zimbabwe and percentage of population with at least doctorate degree education in the United States with a correlation coefficient (R) of -0.258 and weighted average of 2.2%, a difference of 48.6%.
Doctorate Degree Correlation Summary
| Measurement | Aleut | Immigrants from Zimbabwe |
| Minimum | 0.13% | 0.30% |
| Maximum | 8.5% | 5.8% |
| Range | 8.3% | 5.5% |
| Mean | 2.1% | 2.0% |
| Median | 1.2% | 1.9% |
| Interquartile 25% (IQ1) | 0.74% | 1.2% |
| Interquartile 75% (IQ3) | 1.8% | 2.4% |
| Interquartile Range (IQR) | 1.1% | 1.1% |
| Standard Deviation (Sample) | 2.4% | 1.1% |
| Standard Deviation (Population) | 2.3% | 1.1% |
Similar Demographics by Doctorate Degree
Demographics Similar to Aleuts by Doctorate Degree
In terms of doctorate degree, the demographic groups most similar to Aleuts are Paiute (1.5%, a difference of 0.050%), Yaqui (1.5%, a difference of 0.12%), Sioux (1.5%, a difference of 0.14%), Immigrants from Barbados (1.5%, a difference of 0.25%), and Immigrants from Trinidad and Tobago (1.5%, a difference of 0.34%).
| Demographics | Rating | Rank | Doctorate Degree |
| U.S. Virgin Islanders | 0.5 /100 | #268 | Tragic 1.5% |
| Crow | 0.5 /100 | #269 | Tragic 1.5% |
| Salvadorans | 0.5 /100 | #270 | Tragic 1.5% |
| Immigrants | Trinidad and Tobago | 0.5 /100 | #271 | Tragic 1.5% |
| Immigrants | Barbados | 0.4 /100 | #272 | Tragic 1.5% |
| Sioux | 0.4 /100 | #273 | Tragic 1.5% |
| Yaqui | 0.4 /100 | #274 | Tragic 1.5% |
| Aleuts | 0.4 /100 | #275 | Tragic 1.5% |
| Paiute | 0.4 /100 | #276 | Tragic 1.5% |
| Bahamians | 0.4 /100 | #277 | Tragic 1.5% |
| Hawaiians | 0.4 /100 | #278 | Tragic 1.5% |
| Marshallese | 0.4 /100 | #279 | Tragic 1.5% |
| Ecuadorians | 0.4 /100 | #280 | Tragic 1.5% |
| Tohono O'odham | 0.4 /100 | #281 | Tragic 1.5% |
| British West Indians | 0.3 /100 | #282 | Tragic 1.5% |
Demographics Similar to Immigrants from Zimbabwe by Doctorate Degree
In terms of doctorate degree, the demographic groups most similar to Immigrants from Zimbabwe are Egyptian (2.2%, a difference of 0.11%), Immigrants from Nepal (2.2%, a difference of 0.36%), British (2.2%, a difference of 0.80%), Immigrants from Brazil (2.2%, a difference of 0.81%), and Immigrants from Scotland (2.2%, a difference of 0.82%).
| Demographics | Rating | Rank | Doctorate Degree |
| Ugandans | 99.7 /100 | #80 | Exceptional 2.2% |
| Immigrants | Argentina | 99.7 /100 | #81 | Exceptional 2.2% |
| Immigrants | Uganda | 99.6 /100 | #82 | Exceptional 2.2% |
| Immigrants | Lithuania | 99.6 /100 | #83 | Exceptional 2.2% |
| Immigrants | England | 99.6 /100 | #84 | Exceptional 2.2% |
| Immigrants | Brazil | 99.6 /100 | #85 | Exceptional 2.2% |
| Egyptians | 99.4 /100 | #86 | Exceptional 2.2% |
| Immigrants | Zimbabwe | 99.4 /100 | #87 | Exceptional 2.2% |
| Immigrants | Nepal | 99.3 /100 | #88 | Exceptional 2.2% |
| British | 99.3 /100 | #89 | Exceptional 2.2% |
| Immigrants | Scotland | 99.2 /100 | #90 | Exceptional 2.2% |
| Immigrants | Sudan | 99.1 /100 | #91 | Exceptional 2.2% |
| Chileans | 99.1 /100 | #92 | Exceptional 2.2% |
| Alsatians | 99.0 /100 | #93 | Exceptional 2.1% |
| Greeks | 98.8 /100 | #94 | Exceptional 2.1% |