Aleut vs Immigrants from Zimbabwe Female Unemployment
COMPARE
Aleut
Immigrants from Zimbabwe
Female Unemployment
Female Unemployment Comparison
Aleuts
Immigrants from Zimbabwe
5.5%
FEMALE UNEMPLOYMENT
3.0/ 100
METRIC RATING
239th/ 347
METRIC RANK
4.9%
FEMALE UNEMPLOYMENT
99.0/ 100
METRIC RATING
54th/ 347
METRIC RANK
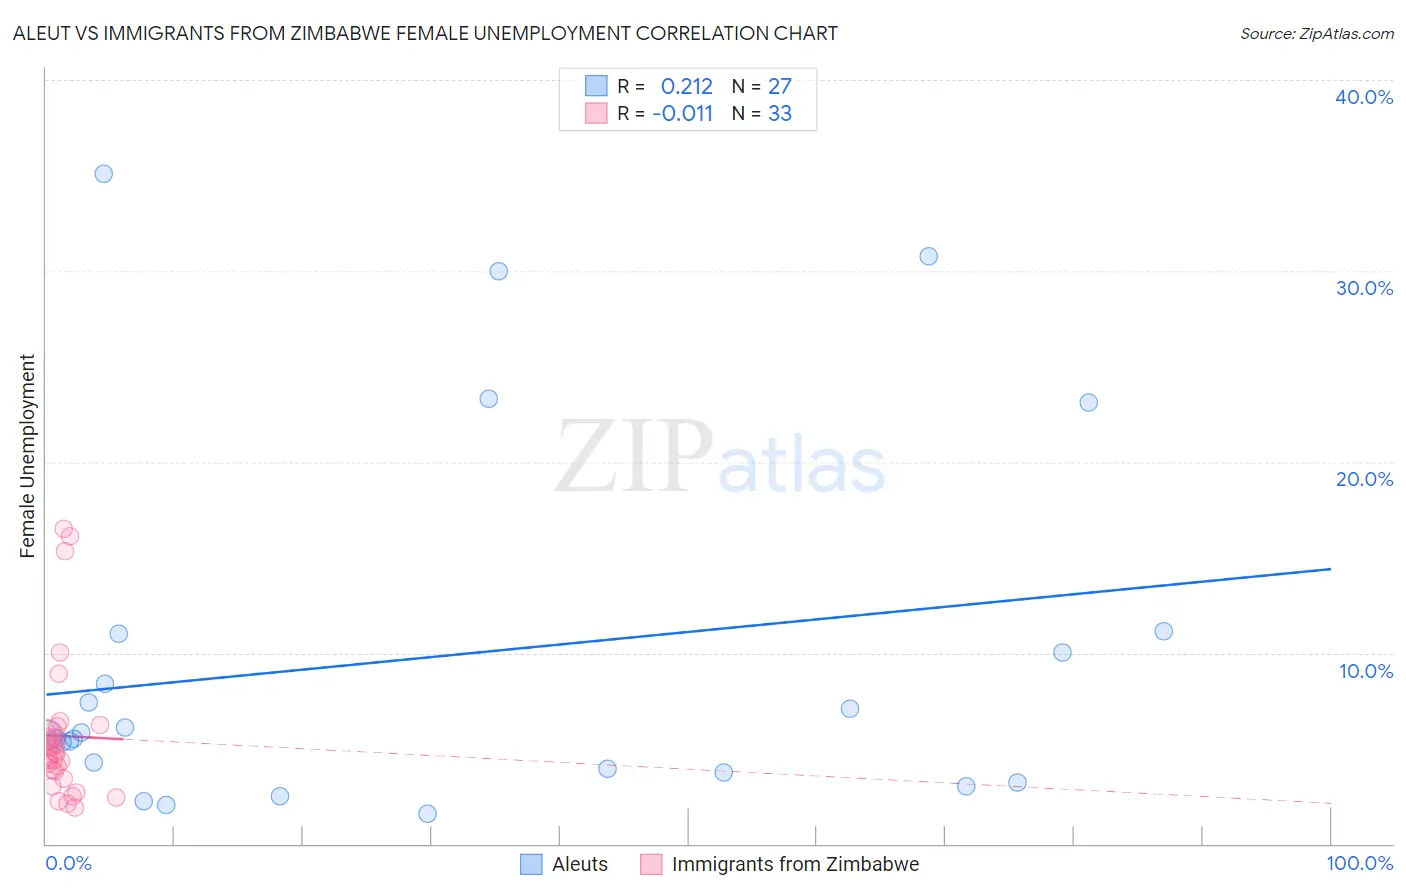
Aleut vs Immigrants from Zimbabwe Female Unemployment Correlation Chart
The statistical analysis conducted on geographies consisting of 61,655,077 people shows a weak positive correlation between the proportion of Aleuts and unemploymnet rate among females in the United States with a correlation coefficient (R) of 0.212 and weighted average of 5.5%. Similarly, the statistical analysis conducted on geographies consisting of 117,690,630 people shows no correlation between the proportion of Immigrants from Zimbabwe and unemploymnet rate among females in the United States with a correlation coefficient (R) of -0.011 and weighted average of 4.9%, a difference of 13.1%.
Female Unemployment Correlation Summary
| Measurement | Aleut | Immigrants from Zimbabwe |
| Minimum | 1.6% | 1.9% |
| Maximum | 35.1% | 16.5% |
| Range | 33.5% | 14.6% |
| Mean | 9.7% | 5.7% |
| Median | 5.7% | 4.7% |
| Interquartile 25% (IQ1) | 3.7% | 3.6% |
| Interquartile 75% (IQ3) | 11.0% | 5.9% |
| Interquartile Range (IQR) | 7.3% | 2.3% |
| Standard Deviation (Sample) | 9.7% | 3.8% |
| Standard Deviation (Population) | 9.5% | 3.7% |
Similar Demographics by Female Unemployment
Demographics Similar to Aleuts by Female Unemployment
In terms of female unemployment, the demographic groups most similar to Aleuts are Immigrants from South America (5.5%, a difference of 0.040%), South American Indian (5.5%, a difference of 0.080%), Sierra Leonean (5.5%, a difference of 0.10%), Immigrants from Panama (5.5%, a difference of 0.12%), and Immigrants from Cambodia (5.5%, a difference of 0.14%).
| Demographics | Rating | Rank | Female Unemployment |
| Liberians | 3.9 /100 | #232 | Tragic 5.5% |
| Moroccans | 3.4 /100 | #233 | Tragic 5.5% |
| Immigrants | Lebanon | 3.3 /100 | #234 | Tragic 5.5% |
| Immigrants | Iran | 3.3 /100 | #235 | Tragic 5.5% |
| Immigrants | Cambodia | 3.3 /100 | #236 | Tragic 5.5% |
| Immigrants | Panama | 3.2 /100 | #237 | Tragic 5.5% |
| Sierra Leoneans | 3.2 /100 | #238 | Tragic 5.5% |
| Aleuts | 3.0 /100 | #239 | Tragic 5.5% |
| Immigrants | South America | 2.9 /100 | #240 | Tragic 5.5% |
| South American Indians | 2.8 /100 | #241 | Tragic 5.5% |
| Marshallese | 2.3 /100 | #242 | Tragic 5.6% |
| Spanish Americans | 2.2 /100 | #243 | Tragic 5.6% |
| Immigrants | Liberia | 1.5 /100 | #244 | Tragic 5.6% |
| Guamanians/Chamorros | 1.4 /100 | #245 | Tragic 5.6% |
| Japanese | 1.2 /100 | #246 | Tragic 5.6% |
Demographics Similar to Immigrants from Zimbabwe by Female Unemployment
In terms of female unemployment, the demographic groups most similar to Immigrants from Zimbabwe are Immigrants from Moldova (4.9%, a difference of 0.020%), Serbian (4.9%, a difference of 0.030%), White/Caucasian (4.9%, a difference of 0.060%), Slavic (4.9%, a difference of 0.090%), and Cambodian (4.9%, a difference of 0.11%).
| Demographics | Rating | Rank | Female Unemployment |
| Okinawans | 99.3 /100 | #47 | Exceptional 4.9% |
| Thais | 99.2 /100 | #48 | Exceptional 4.9% |
| Australians | 99.2 /100 | #49 | Exceptional 4.9% |
| Immigrants | Cuba | 99.1 /100 | #50 | Exceptional 4.9% |
| Cambodians | 99.1 /100 | #51 | Exceptional 4.9% |
| Slavs | 99.1 /100 | #52 | Exceptional 4.9% |
| Whites/Caucasians | 99.0 /100 | #53 | Exceptional 4.9% |
| Immigrants | Zimbabwe | 99.0 /100 | #54 | Exceptional 4.9% |
| Immigrants | Moldova | 99.0 /100 | #55 | Exceptional 4.9% |
| Serbians | 99.0 /100 | #56 | Exceptional 4.9% |
| Icelanders | 98.8 /100 | #57 | Exceptional 4.9% |
| Immigrants | Lithuania | 98.8 /100 | #58 | Exceptional 4.9% |
| Bhutanese | 98.7 /100 | #59 | Exceptional 4.9% |
| Immigrants | Scotland | 98.6 /100 | #60 | Exceptional 4.9% |
| Immigrants | Canada | 98.6 /100 | #61 | Exceptional 4.9% |