Creek vs Immigrants from Zimbabwe Doctorate Degree
COMPARE
Creek
Immigrants from Zimbabwe
Doctorate Degree
Doctorate Degree Comparison
Creek
Immigrants from Zimbabwe
1.3%
DOCTORATE DEGREE
0.1/ 100
METRIC RATING
318th/ 347
METRIC RANK
2.2%
DOCTORATE DEGREE
99.4/ 100
METRIC RATING
87th/ 347
METRIC RANK
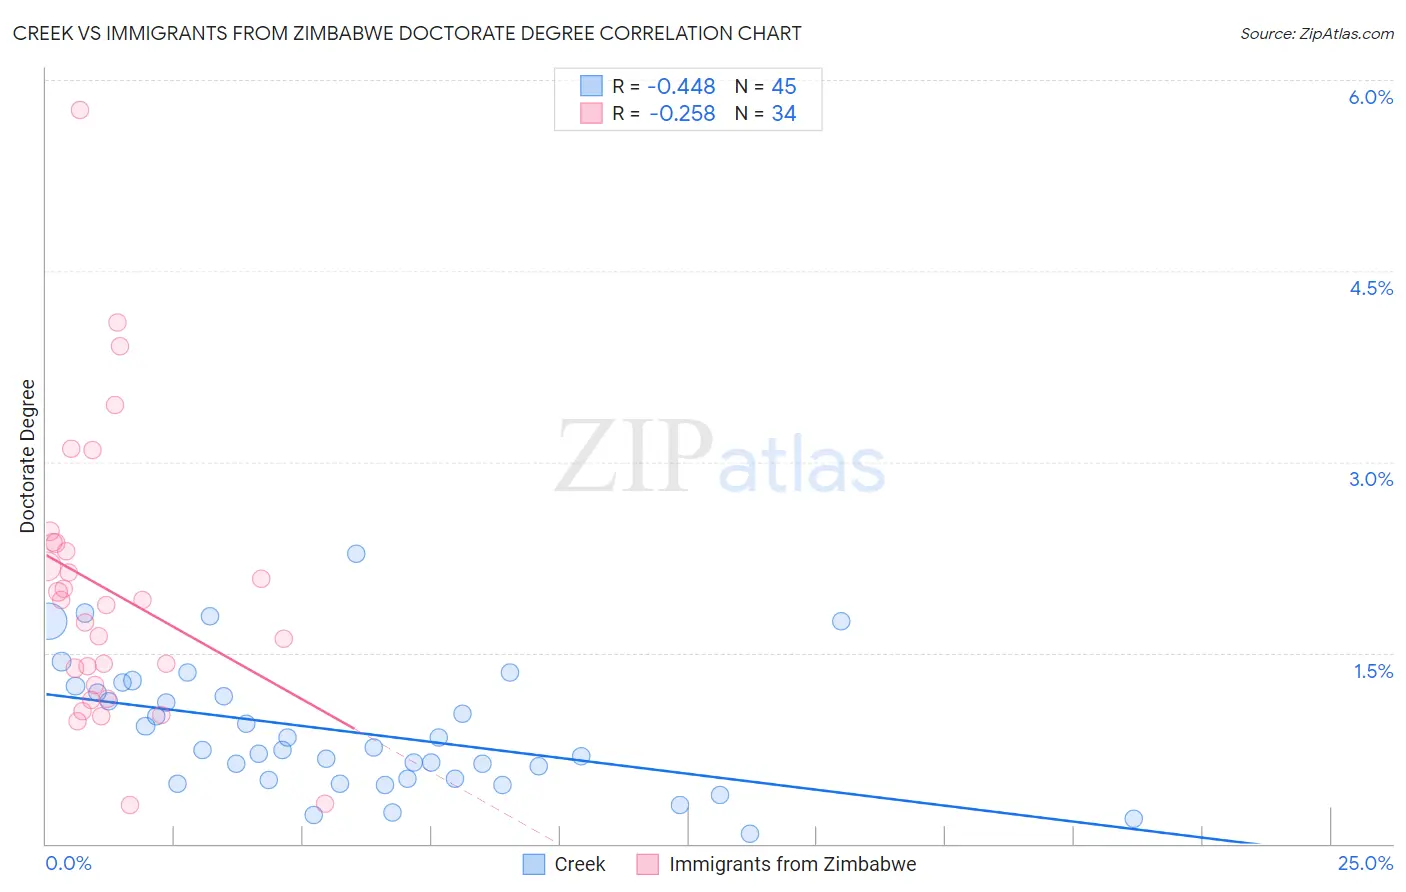
Creek vs Immigrants from Zimbabwe Doctorate Degree Correlation Chart
The statistical analysis conducted on geographies consisting of 176,594,001 people shows a moderate negative correlation between the proportion of Creek and percentage of population with at least doctorate degree education in the United States with a correlation coefficient (R) of -0.448 and weighted average of 1.3%. Similarly, the statistical analysis conducted on geographies consisting of 117,524,590 people shows a weak negative correlation between the proportion of Immigrants from Zimbabwe and percentage of population with at least doctorate degree education in the United States with a correlation coefficient (R) of -0.258 and weighted average of 2.2%, a difference of 62.3%.
Doctorate Degree Correlation Summary
| Measurement | Creek | Immigrants from Zimbabwe |
| Minimum | 0.080% | 0.30% |
| Maximum | 2.3% | 5.8% |
| Range | 2.2% | 5.5% |
| Mean | 0.88% | 2.0% |
| Median | 0.74% | 1.9% |
| Interquartile 25% (IQ1) | 0.50% | 1.2% |
| Interquartile 75% (IQ3) | 1.2% | 2.4% |
| Interquartile Range (IQR) | 0.71% | 1.1% |
| Standard Deviation (Sample) | 0.50% | 1.1% |
| Standard Deviation (Population) | 0.49% | 1.1% |
Similar Demographics by Doctorate Degree
Demographics Similar to Creek by Doctorate Degree
In terms of doctorate degree, the demographic groups most similar to Creek are Immigrants from Micronesia (1.3%, a difference of 0.050%), Navajo (1.4%, a difference of 0.30%), Immigrants from the Azores (1.4%, a difference of 0.51%), Dominican (1.4%, a difference of 0.53%), and Menominee (1.4%, a difference of 0.61%).
| Demographics | Rating | Rank | Doctorate Degree |
| Immigrants | Honduras | 0.1 /100 | #311 | Tragic 1.4% |
| Immigrants | Nicaragua | 0.1 /100 | #312 | Tragic 1.4% |
| Menominee | 0.1 /100 | #313 | Tragic 1.4% |
| Dominicans | 0.1 /100 | #314 | Tragic 1.4% |
| Immigrants | Azores | 0.1 /100 | #315 | Tragic 1.4% |
| Navajo | 0.1 /100 | #316 | Tragic 1.4% |
| Immigrants | Micronesia | 0.1 /100 | #317 | Tragic 1.3% |
| Creek | 0.1 /100 | #318 | Tragic 1.3% |
| Immigrants | Guyana | 0.1 /100 | #319 | Tragic 1.3% |
| Immigrants | St. Vincent and the Grenadines | 0.1 /100 | #320 | Tragic 1.3% |
| Dutch West Indians | 0.1 /100 | #321 | Tragic 1.3% |
| Seminole | 0.1 /100 | #322 | Tragic 1.3% |
| Immigrants | Belize | 0.1 /100 | #323 | Tragic 1.3% |
| Natives/Alaskans | 0.0 /100 | #324 | Tragic 1.3% |
| Pima | 0.0 /100 | #325 | Tragic 1.3% |
Demographics Similar to Immigrants from Zimbabwe by Doctorate Degree
In terms of doctorate degree, the demographic groups most similar to Immigrants from Zimbabwe are Egyptian (2.2%, a difference of 0.11%), Immigrants from Nepal (2.2%, a difference of 0.36%), British (2.2%, a difference of 0.80%), Immigrants from Brazil (2.2%, a difference of 0.81%), and Immigrants from Scotland (2.2%, a difference of 0.82%).
| Demographics | Rating | Rank | Doctorate Degree |
| Ugandans | 99.7 /100 | #80 | Exceptional 2.2% |
| Immigrants | Argentina | 99.7 /100 | #81 | Exceptional 2.2% |
| Immigrants | Uganda | 99.6 /100 | #82 | Exceptional 2.2% |
| Immigrants | Lithuania | 99.6 /100 | #83 | Exceptional 2.2% |
| Immigrants | England | 99.6 /100 | #84 | Exceptional 2.2% |
| Immigrants | Brazil | 99.6 /100 | #85 | Exceptional 2.2% |
| Egyptians | 99.4 /100 | #86 | Exceptional 2.2% |
| Immigrants | Zimbabwe | 99.4 /100 | #87 | Exceptional 2.2% |
| Immigrants | Nepal | 99.3 /100 | #88 | Exceptional 2.2% |
| British | 99.3 /100 | #89 | Exceptional 2.2% |
| Immigrants | Scotland | 99.2 /100 | #90 | Exceptional 2.2% |
| Immigrants | Sudan | 99.1 /100 | #91 | Exceptional 2.2% |
| Chileans | 99.1 /100 | #92 | Exceptional 2.2% |
| Alsatians | 99.0 /100 | #93 | Exceptional 2.1% |
| Greeks | 98.8 /100 | #94 | Exceptional 2.1% |