Jordanian vs Immigrants from Zimbabwe Doctorate Degree
COMPARE
Jordanian
Immigrants from Zimbabwe
Doctorate Degree
Doctorate Degree Comparison
Jordanians
Immigrants from Zimbabwe
2.0%
DOCTORATE DEGREE
92.1/ 100
METRIC RATING
126th/ 347
METRIC RANK
2.2%
DOCTORATE DEGREE
99.4/ 100
METRIC RATING
87th/ 347
METRIC RANK
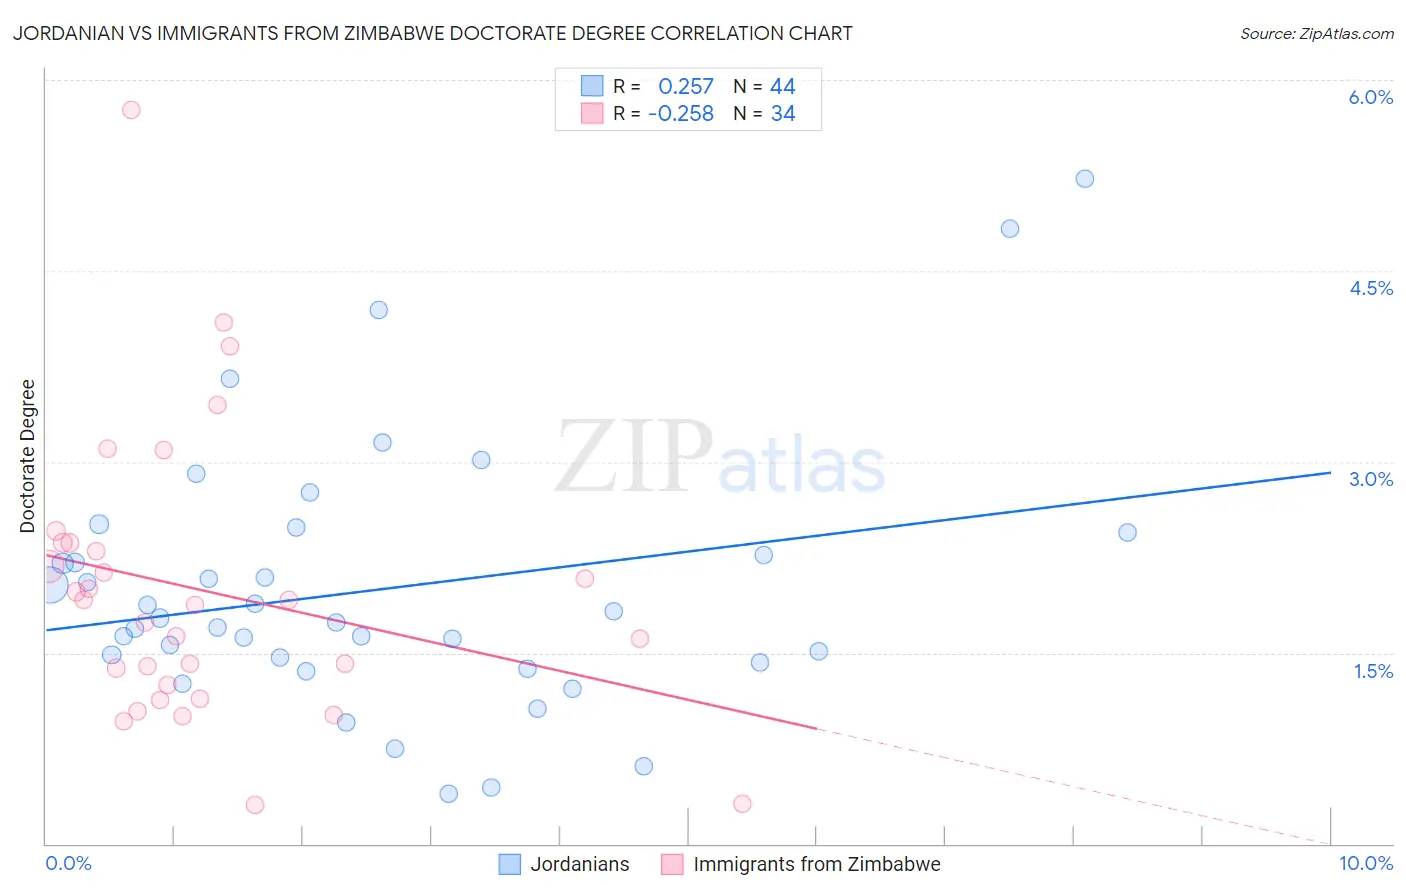
Jordanian vs Immigrants from Zimbabwe Doctorate Degree Correlation Chart
The statistical analysis conducted on geographies consisting of 166,045,930 people shows a weak positive correlation between the proportion of Jordanians and percentage of population with at least doctorate degree education in the United States with a correlation coefficient (R) of 0.257 and weighted average of 2.0%. Similarly, the statistical analysis conducted on geographies consisting of 117,524,590 people shows a weak negative correlation between the proportion of Immigrants from Zimbabwe and percentage of population with at least doctorate degree education in the United States with a correlation coefficient (R) of -0.258 and weighted average of 2.2%, a difference of 9.0%.
Doctorate Degree Correlation Summary
| Measurement | Jordanian | Immigrants from Zimbabwe |
| Minimum | 0.39% | 0.30% |
| Maximum | 5.2% | 5.8% |
| Range | 4.8% | 5.5% |
| Mean | 2.0% | 2.0% |
| Median | 1.8% | 1.9% |
| Interquartile 25% (IQ1) | 1.4% | 1.2% |
| Interquartile 75% (IQ3) | 2.4% | 2.4% |
| Interquartile Range (IQR) | 0.91% | 1.1% |
| Standard Deviation (Sample) | 1.0% | 1.1% |
| Standard Deviation (Population) | 1.0% | 1.1% |
Similar Demographics by Doctorate Degree
Demographics Similar to Jordanians by Doctorate Degree
In terms of doctorate degree, the demographic groups most similar to Jordanians are Palestinian (2.0%, a difference of 0.040%), Moroccan (2.0%, a difference of 0.42%), Immigrants from Zaire (2.0%, a difference of 0.46%), Ute (2.0%, a difference of 0.52%), and Canadian (2.0%, a difference of 0.67%).
| Demographics | Rating | Rank | Doctorate Degree |
| Pakistanis | 95.8 /100 | #119 | Exceptional 2.0% |
| Immigrants | Morocco | 95.5 /100 | #120 | Exceptional 2.0% |
| Immigrants | Jordan | 94.8 /100 | #121 | Exceptional 2.0% |
| Immigrants | Southern Europe | 94.7 /100 | #122 | Exceptional 2.0% |
| Croatians | 94.0 /100 | #123 | Exceptional 2.0% |
| Ute | 93.2 /100 | #124 | Exceptional 2.0% |
| Moroccans | 93.0 /100 | #125 | Exceptional 2.0% |
| Jordanians | 92.1 /100 | #126 | Exceptional 2.0% |
| Palestinians | 92.0 /100 | #127 | Exceptional 2.0% |
| Immigrants | Zaire | 91.1 /100 | #128 | Exceptional 2.0% |
| Canadians | 90.6 /100 | #129 | Exceptional 2.0% |
| Immigrants | Ukraine | 90.5 /100 | #130 | Exceptional 2.0% |
| Immigrants | Sierra Leone | 90.2 /100 | #131 | Exceptional 2.0% |
| Scottish | 89.4 /100 | #132 | Excellent 2.0% |
| Immigrants | Uzbekistan | 89.3 /100 | #133 | Excellent 2.0% |
Demographics Similar to Immigrants from Zimbabwe by Doctorate Degree
In terms of doctorate degree, the demographic groups most similar to Immigrants from Zimbabwe are Egyptian (2.2%, a difference of 0.11%), Immigrants from Nepal (2.2%, a difference of 0.36%), British (2.2%, a difference of 0.80%), Immigrants from Brazil (2.2%, a difference of 0.81%), and Immigrants from Scotland (2.2%, a difference of 0.82%).
| Demographics | Rating | Rank | Doctorate Degree |
| Ugandans | 99.7 /100 | #80 | Exceptional 2.2% |
| Immigrants | Argentina | 99.7 /100 | #81 | Exceptional 2.2% |
| Immigrants | Uganda | 99.6 /100 | #82 | Exceptional 2.2% |
| Immigrants | Lithuania | 99.6 /100 | #83 | Exceptional 2.2% |
| Immigrants | England | 99.6 /100 | #84 | Exceptional 2.2% |
| Immigrants | Brazil | 99.6 /100 | #85 | Exceptional 2.2% |
| Egyptians | 99.4 /100 | #86 | Exceptional 2.2% |
| Immigrants | Zimbabwe | 99.4 /100 | #87 | Exceptional 2.2% |
| Immigrants | Nepal | 99.3 /100 | #88 | Exceptional 2.2% |
| British | 99.3 /100 | #89 | Exceptional 2.2% |
| Immigrants | Scotland | 99.2 /100 | #90 | Exceptional 2.2% |
| Immigrants | Sudan | 99.1 /100 | #91 | Exceptional 2.2% |
| Chileans | 99.1 /100 | #92 | Exceptional 2.2% |
| Alsatians | 99.0 /100 | #93 | Exceptional 2.1% |
| Greeks | 98.8 /100 | #94 | Exceptional 2.1% |