Immigrants from Scotland vs Immigrants from Zimbabwe Doctorate Degree
COMPARE
Immigrants from Scotland
Immigrants from Zimbabwe
Doctorate Degree
Doctorate Degree Comparison
Immigrants from Scotland
Immigrants from Zimbabwe
2.2%
DOCTORATE DEGREE
99.2/ 100
METRIC RATING
90th/ 347
METRIC RANK
2.2%
DOCTORATE DEGREE
99.4/ 100
METRIC RATING
87th/ 347
METRIC RANK
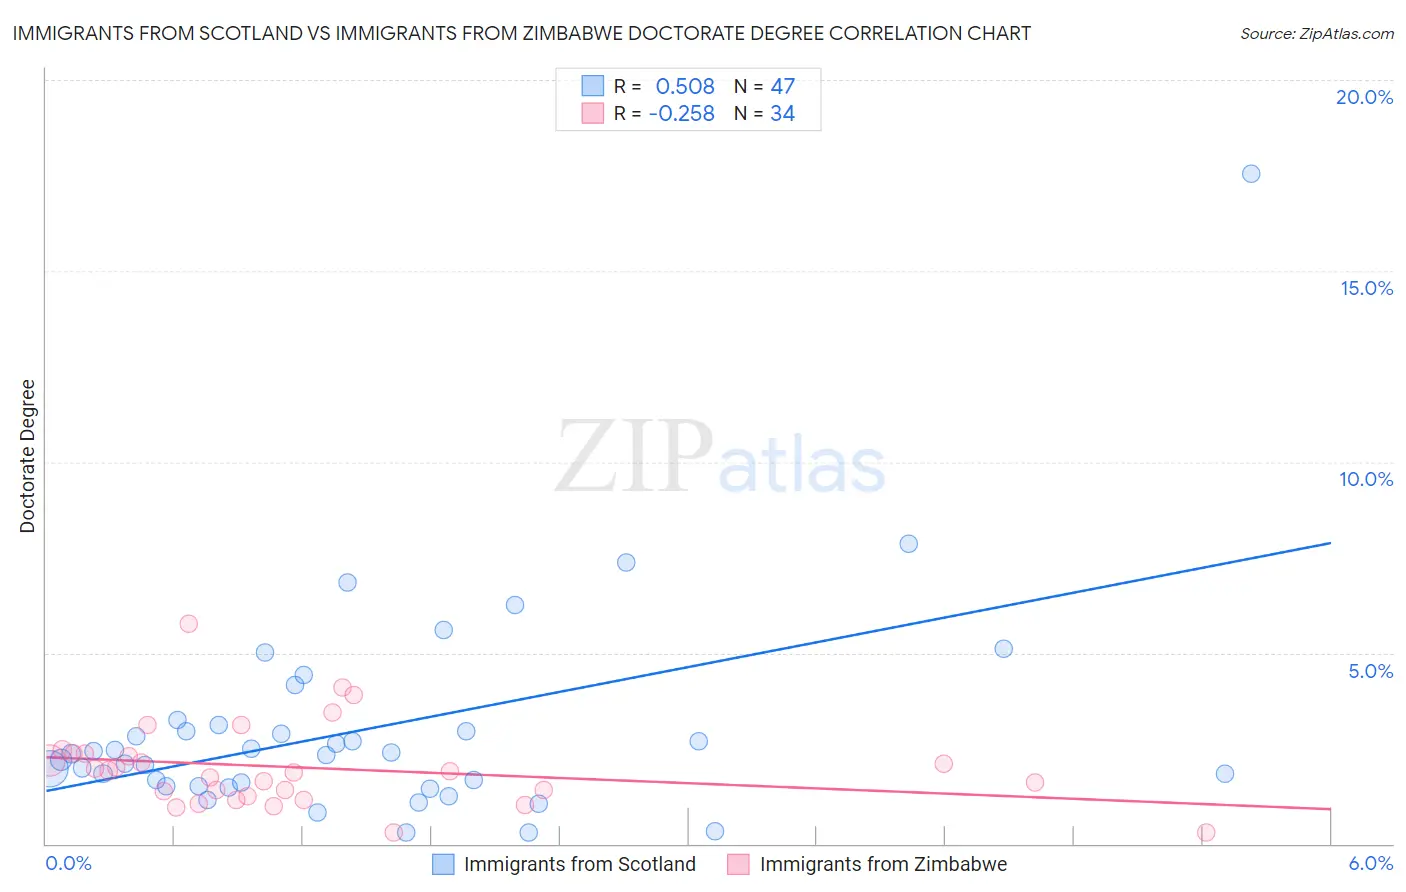
Immigrants from Scotland vs Immigrants from Zimbabwe Doctorate Degree Correlation Chart
The statistical analysis conducted on geographies consisting of 195,756,585 people shows a substantial positive correlation between the proportion of Immigrants from Scotland and percentage of population with at least doctorate degree education in the United States with a correlation coefficient (R) of 0.508 and weighted average of 2.2%. Similarly, the statistical analysis conducted on geographies consisting of 117,524,590 people shows a weak negative correlation between the proportion of Immigrants from Zimbabwe and percentage of population with at least doctorate degree education in the United States with a correlation coefficient (R) of -0.258 and weighted average of 2.2%, a difference of 0.82%.
Doctorate Degree Correlation Summary
| Measurement | Immigrants from Scotland | Immigrants from Zimbabwe |
| Minimum | 0.29% | 0.30% |
| Maximum | 17.6% | 5.8% |
| Range | 17.3% | 5.5% |
| Mean | 3.0% | 2.0% |
| Median | 2.3% | 1.9% |
| Interquartile 25% (IQ1) | 1.5% | 1.2% |
| Interquartile 75% (IQ3) | 3.1% | 2.4% |
| Interquartile Range (IQR) | 1.6% | 1.1% |
| Standard Deviation (Sample) | 2.8% | 1.1% |
| Standard Deviation (Population) | 2.8% | 1.1% |
Demographics Similar to Immigrants from Scotland and Immigrants from Zimbabwe by Doctorate Degree
In terms of doctorate degree, the demographic groups most similar to Immigrants from Scotland are British (2.2%, a difference of 0.020%), Immigrants from Nepal (2.2%, a difference of 0.45%), Immigrants from Sudan (2.2%, a difference of 0.47%), Chilean (2.2%, a difference of 0.73%), and Egyptian (2.2%, a difference of 0.93%). Similarly, the demographic groups most similar to Immigrants from Zimbabwe are Egyptian (2.2%, a difference of 0.11%), Immigrants from Nepal (2.2%, a difference of 0.36%), British (2.2%, a difference of 0.80%), Immigrants from Brazil (2.2%, a difference of 0.81%), and Immigrants from England (2.2%, a difference of 0.94%).
| Demographics | Rating | Rank | Doctorate Degree |
| Immigrants | Belarus | 99.7 /100 | #78 | Exceptional 2.2% |
| Northern Europeans | 99.7 /100 | #79 | Exceptional 2.2% |
| Ugandans | 99.7 /100 | #80 | Exceptional 2.2% |
| Immigrants | Argentina | 99.7 /100 | #81 | Exceptional 2.2% |
| Immigrants | Uganda | 99.6 /100 | #82 | Exceptional 2.2% |
| Immigrants | Lithuania | 99.6 /100 | #83 | Exceptional 2.2% |
| Immigrants | England | 99.6 /100 | #84 | Exceptional 2.2% |
| Immigrants | Brazil | 99.6 /100 | #85 | Exceptional 2.2% |
| Egyptians | 99.4 /100 | #86 | Exceptional 2.2% |
| Immigrants | Zimbabwe | 99.4 /100 | #87 | Exceptional 2.2% |
| Immigrants | Nepal | 99.3 /100 | #88 | Exceptional 2.2% |
| British | 99.3 /100 | #89 | Exceptional 2.2% |
| Immigrants | Scotland | 99.2 /100 | #90 | Exceptional 2.2% |
| Immigrants | Sudan | 99.1 /100 | #91 | Exceptional 2.2% |
| Chileans | 99.1 /100 | #92 | Exceptional 2.2% |
| Alsatians | 99.0 /100 | #93 | Exceptional 2.1% |
| Greeks | 98.8 /100 | #94 | Exceptional 2.1% |
| Immigrants | Romania | 98.7 /100 | #95 | Exceptional 2.1% |
| Immigrants | Northern Africa | 98.4 /100 | #96 | Exceptional 2.1% |
| Immigrants | Eritrea | 98.4 /100 | #97 | Exceptional 2.1% |
| Armenians | 98.3 /100 | #98 | Exceptional 2.1% |