Albanian vs Luxembourger College, Under 1 year
COMPARE
Albanian
Luxembourger
College, Under 1 year
College, Under 1 year Comparison
Albanians
Luxembourgers
65.9%
COLLEGE, UNDER 1 YEAR
66.1/ 100
METRIC RATING
160th/ 347
METRIC RANK
68.2%
COLLEGE, UNDER 1 YEAR
98.1/ 100
METRIC RATING
92nd/ 347
METRIC RANK
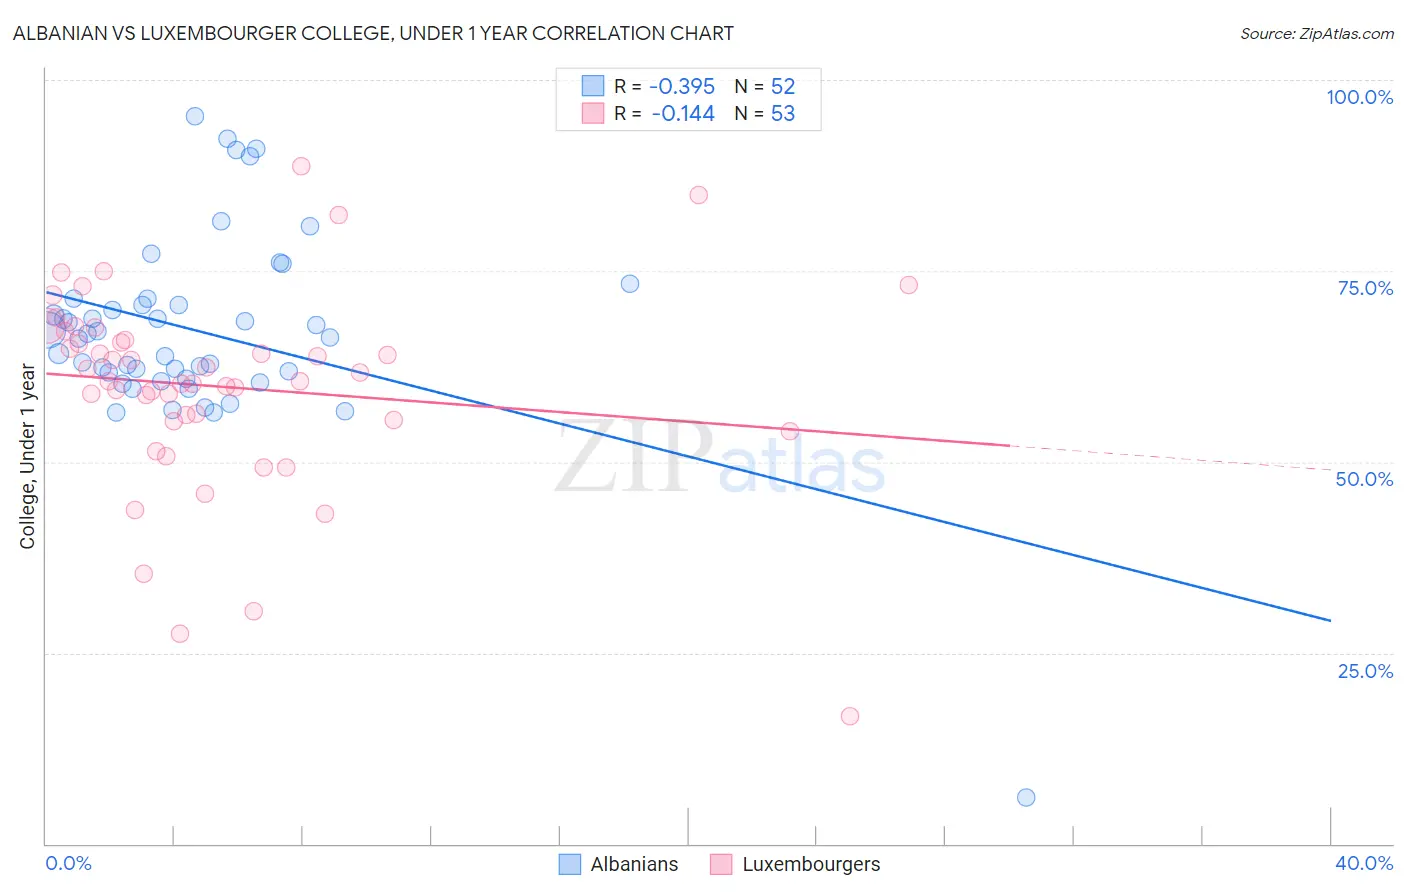
Albanian vs Luxembourger College, Under 1 year Correlation Chart
The statistical analysis conducted on geographies consisting of 193,265,850 people shows a mild negative correlation between the proportion of Albanians and percentage of population with at least college, under 1 year education in the United States with a correlation coefficient (R) of -0.395 and weighted average of 65.9%. Similarly, the statistical analysis conducted on geographies consisting of 144,676,190 people shows a poor negative correlation between the proportion of Luxembourgers and percentage of population with at least college, under 1 year education in the United States with a correlation coefficient (R) of -0.144 and weighted average of 68.2%, a difference of 3.6%.
College, Under 1 year Correlation Summary
| Measurement | Albanian | Luxembourger |
| Minimum | 6.0% | 16.7% |
| Maximum | 95.3% | 88.7% |
| Range | 89.3% | 72.1% |
| Mean | 67.1% | 59.8% |
| Median | 66.5% | 60.6% |
| Interquartile 25% (IQ1) | 61.3% | 55.4% |
| Interquartile 75% (IQ3) | 70.9% | 66.5% |
| Interquartile Range (IQR) | 9.6% | 11.1% |
| Standard Deviation (Sample) | 13.1% | 13.2% |
| Standard Deviation (Population) | 13.0% | 13.1% |
Similar Demographics by College, Under 1 year
Demographics Similar to Albanians by College, Under 1 year
In terms of college, under 1 year, the demographic groups most similar to Albanians are Tlingit-Haida (65.9%, a difference of 0.010%), Brazilian (65.9%, a difference of 0.010%), Korean (65.9%, a difference of 0.040%), Celtic (65.9%, a difference of 0.060%), and Sierra Leonean (66.0%, a difference of 0.080%).
| Demographics | Rating | Rank | College, Under 1 year |
| Belgians | 73.7 /100 | #153 | Good 66.2% |
| Immigrants | Eritrea | 71.9 /100 | #154 | Good 66.1% |
| Irish | 70.3 /100 | #155 | Good 66.0% |
| Welsh | 69.9 /100 | #156 | Good 66.0% |
| Sierra Leoneans | 67.8 /100 | #157 | Good 66.0% |
| Celtics | 67.3 /100 | #158 | Good 65.9% |
| Tlingit-Haida | 66.4 /100 | #159 | Good 65.9% |
| Albanians | 66.1 /100 | #160 | Good 65.9% |
| Brazilians | 66.0 /100 | #161 | Good 65.9% |
| Koreans | 65.3 /100 | #162 | Good 65.9% |
| Somalis | 62.7 /100 | #163 | Good 65.8% |
| Czechoslovakians | 62.6 /100 | #164 | Good 65.8% |
| Immigrants | Uzbekistan | 61.6 /100 | #165 | Good 65.8% |
| Moroccans | 56.7 /100 | #166 | Average 65.6% |
| Immigrants | Somalia | 56.4 /100 | #167 | Average 65.6% |
Demographics Similar to Luxembourgers by College, Under 1 year
In terms of college, under 1 year, the demographic groups most similar to Luxembourgers are European (68.2%, a difference of 0.010%), Icelander (68.3%, a difference of 0.040%), Romanian (68.2%, a difference of 0.090%), Ethiopian (68.3%, a difference of 0.10%), and Croatian (68.3%, a difference of 0.11%).
| Demographics | Rating | Rank | College, Under 1 year |
| Egyptians | 98.3 /100 | #85 | Exceptional 68.3% |
| Immigrants | Lebanon | 98.3 /100 | #86 | Exceptional 68.3% |
| Chinese | 98.3 /100 | #87 | Exceptional 68.3% |
| Croatians | 98.2 /100 | #88 | Exceptional 68.3% |
| Ethiopians | 98.2 /100 | #89 | Exceptional 68.3% |
| Icelanders | 98.1 /100 | #90 | Exceptional 68.3% |
| Europeans | 98.1 /100 | #91 | Exceptional 68.2% |
| Luxembourgers | 98.1 /100 | #92 | Exceptional 68.2% |
| Romanians | 97.9 /100 | #93 | Exceptional 68.2% |
| Armenians | 97.7 /100 | #94 | Exceptional 68.1% |
| Immigrants | Pakistan | 97.5 /100 | #95 | Exceptional 68.0% |
| Jordanians | 97.4 /100 | #96 | Exceptional 68.0% |
| Immigrants | Ethiopia | 97.3 /100 | #97 | Exceptional 68.0% |
| Paraguayans | 97.1 /100 | #98 | Exceptional 67.9% |
| Immigrants | Bolivia | 97.0 /100 | #99 | Exceptional 67.9% |