Senegalese vs Immigrants from Dominican Republic 9th Grade
COMPARE
Senegalese
Immigrants from Dominican Republic
9th Grade
9th Grade Comparison
Senegalese
Immigrants from Dominican Republic
94.2%
9TH GRADE
1.9/ 100
METRIC RATING
246th/ 347
METRIC RANK
90.5%
9TH GRADE
0.0/ 100
METRIC RATING
336th/ 347
METRIC RANK
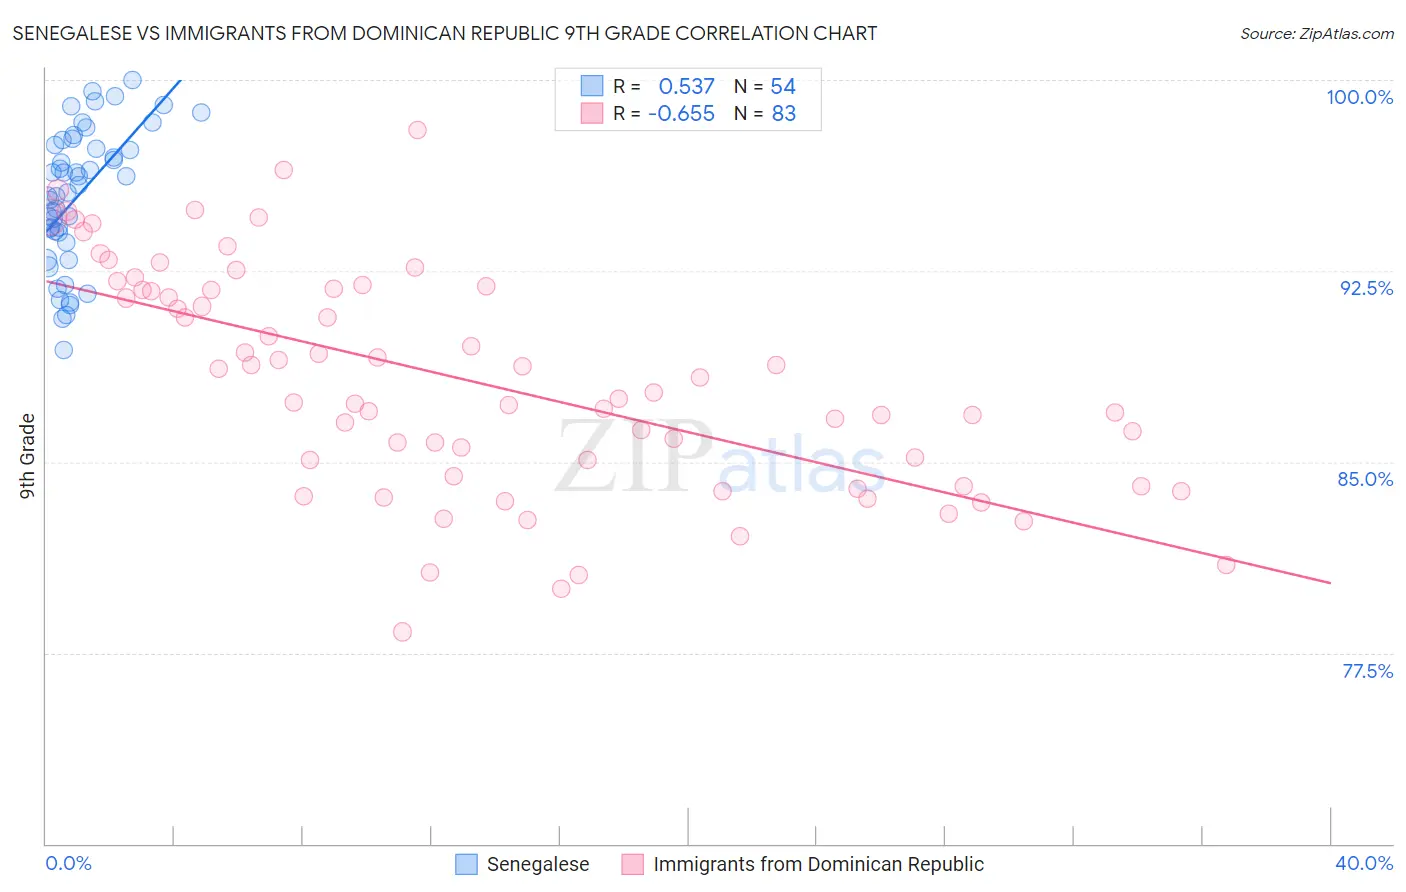
Senegalese vs Immigrants from Dominican Republic 9th Grade Correlation Chart
The statistical analysis conducted on geographies consisting of 78,142,569 people shows a substantial positive correlation between the proportion of Senegalese and percentage of population with at least 9th grade education in the United States with a correlation coefficient (R) of 0.537 and weighted average of 94.2%. Similarly, the statistical analysis conducted on geographies consisting of 275,144,349 people shows a significant negative correlation between the proportion of Immigrants from Dominican Republic and percentage of population with at least 9th grade education in the United States with a correlation coefficient (R) of -0.655 and weighted average of 90.5%, a difference of 4.1%.
9th Grade Correlation Summary
| Measurement | Senegalese | Immigrants from Dominican Republic |
| Minimum | 89.4% | 78.3% |
| Maximum | 100.0% | 98.1% |
| Range | 10.6% | 19.7% |
| Mean | 95.4% | 88.2% |
| Median | 95.7% | 87.7% |
| Interquartile 25% (IQ1) | 94.0% | 84.5% |
| Interquartile 75% (IQ3) | 97.5% | 91.8% |
| Interquartile Range (IQR) | 3.4% | 7.3% |
| Standard Deviation (Sample) | 2.7% | 4.4% |
| Standard Deviation (Population) | 2.6% | 4.4% |
Similar Demographics by 9th Grade
Demographics Similar to Senegalese by 9th Grade
In terms of 9th grade, the demographic groups most similar to Senegalese are Paiute (94.2%, a difference of 0.0%), Dutch West Indian (94.2%, a difference of 0.010%), Afghan (94.2%, a difference of 0.010%), Immigrants from Middle Africa (94.2%, a difference of 0.020%), and Immigrants from Cameroon (94.2%, a difference of 0.020%).
| Demographics | Rating | Rank | 9th Grade |
| Immigrants | China | 2.8 /100 | #239 | Tragic 94.3% |
| Immigrants | Ethiopia | 2.7 /100 | #240 | Tragic 94.3% |
| Spanish Americans | 2.6 /100 | #241 | Tragic 94.2% |
| Immigrants | Middle Africa | 2.2 /100 | #242 | Tragic 94.2% |
| Immigrants | Cameroon | 2.1 /100 | #243 | Tragic 94.2% |
| Dutch West Indians | 2.0 /100 | #244 | Tragic 94.2% |
| Paiute | 1.9 /100 | #245 | Tragic 94.2% |
| Senegalese | 1.9 /100 | #246 | Tragic 94.2% |
| Afghans | 1.8 /100 | #247 | Tragic 94.2% |
| Immigrants | Somalia | 1.4 /100 | #248 | Tragic 94.1% |
| Uruguayans | 1.3 /100 | #249 | Tragic 94.1% |
| Immigrants | Hong Kong | 1.3 /100 | #250 | Tragic 94.1% |
| Jamaicans | 1.0 /100 | #251 | Tragic 94.1% |
| Immigrants | Senegal | 0.9 /100 | #252 | Tragic 94.1% |
| Colombians | 0.8 /100 | #253 | Tragic 94.0% |
Demographics Similar to Immigrants from Dominican Republic by 9th Grade
In terms of 9th grade, the demographic groups most similar to Immigrants from Dominican Republic are Immigrants from Latin America (90.4%, a difference of 0.12%), Central American (90.4%, a difference of 0.13%), Immigrants from Honduras (90.6%, a difference of 0.14%), Immigrants from the Azores (90.8%, a difference of 0.31%), and Immigrants from Yemen (90.8%, a difference of 0.36%).
| Demographics | Rating | Rank | 9th Grade |
| Hondurans | 0.0 /100 | #329 | Tragic 91.0% |
| Immigrants | Cabo Verde | 0.0 /100 | #330 | Tragic 90.9% |
| Mexican American Indians | 0.0 /100 | #331 | Tragic 90.9% |
| Hispanics or Latinos | 0.0 /100 | #332 | Tragic 90.9% |
| Immigrants | Yemen | 0.0 /100 | #333 | Tragic 90.8% |
| Immigrants | Azores | 0.0 /100 | #334 | Tragic 90.8% |
| Immigrants | Honduras | 0.0 /100 | #335 | Tragic 90.6% |
| Immigrants | Dominican Republic | 0.0 /100 | #336 | Tragic 90.5% |
| Immigrants | Latin America | 0.0 /100 | #337 | Tragic 90.4% |
| Central Americans | 0.0 /100 | #338 | Tragic 90.4% |
| Yakama | 0.0 /100 | #339 | Tragic 90.1% |
| Mexicans | 0.0 /100 | #340 | Tragic 90.0% |
| Guatemalans | 0.0 /100 | #341 | Tragic 89.9% |
| Salvadorans | 0.0 /100 | #342 | Tragic 89.6% |
| Immigrants | Guatemala | 0.0 /100 | #343 | Tragic 89.4% |