Alaskan Athabascan vs Thai 9th Grade
COMPARE
Alaskan Athabascan
Thai
9th Grade
9th Grade Comparison
Alaskan Athabascans
Thais
96.4%
9TH GRADE
100.0/ 100
METRIC RATING
21st/ 347
METRIC RANK
95.8%
9TH GRADE
99.5/ 100
METRIC RATING
74th/ 347
METRIC RANK
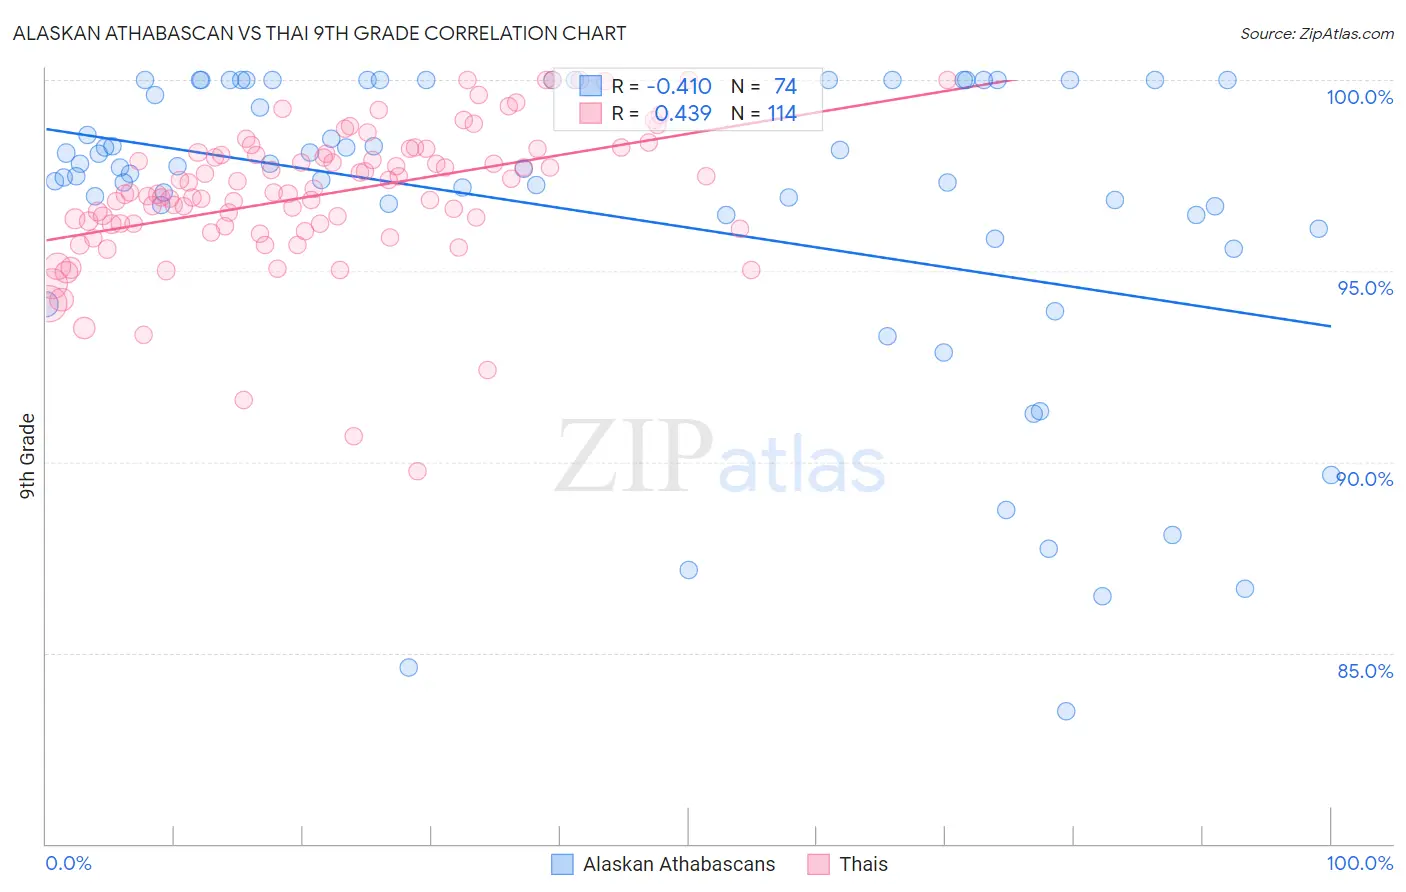
Alaskan Athabascan vs Thai 9th Grade Correlation Chart
The statistical analysis conducted on geographies consisting of 45,820,365 people shows a moderate negative correlation between the proportion of Alaskan Athabascans and percentage of population with at least 9th grade education in the United States with a correlation coefficient (R) of -0.410 and weighted average of 96.4%. Similarly, the statistical analysis conducted on geographies consisting of 475,814,962 people shows a moderate positive correlation between the proportion of Thais and percentage of population with at least 9th grade education in the United States with a correlation coefficient (R) of 0.439 and weighted average of 95.8%, a difference of 0.63%.
9th Grade Correlation Summary
| Measurement | Alaskan Athabascan | Thai |
| Minimum | 83.5% | 89.8% |
| Maximum | 100.0% | 100.0% |
| Range | 16.5% | 10.2% |
| Mean | 96.5% | 97.0% |
| Median | 97.7% | 97.0% |
| Interquartile 25% (IQ1) | 96.4% | 96.2% |
| Interquartile 75% (IQ3) | 100.0% | 98.1% |
| Interquartile Range (IQR) | 3.6% | 1.9% |
| Standard Deviation (Sample) | 4.2% | 1.8% |
| Standard Deviation (Population) | 4.1% | 1.8% |
Similar Demographics by 9th Grade
Demographics Similar to Alaskan Athabascans by 9th Grade
In terms of 9th grade, the demographic groups most similar to Alaskan Athabascans are Italian (96.4%, a difference of 0.010%), European (96.4%, a difference of 0.010%), Welsh (96.4%, a difference of 0.020%), Czech (96.4%, a difference of 0.020%), and Scandinavian (96.5%, a difference of 0.050%).
| Demographics | Rating | Rank | 9th Grade |
| Scottish | 100.0 /100 | #14 | Exceptional 96.5% |
| Irish | 100.0 /100 | #15 | Exceptional 96.5% |
| Croatians | 100.0 /100 | #16 | Exceptional 96.5% |
| Dutch | 100.0 /100 | #17 | Exceptional 96.5% |
| Scandinavians | 100.0 /100 | #18 | Exceptional 96.5% |
| Welsh | 100.0 /100 | #19 | Exceptional 96.4% |
| Italians | 100.0 /100 | #20 | Exceptional 96.4% |
| Alaskan Athabascans | 100.0 /100 | #21 | Exceptional 96.4% |
| Europeans | 100.0 /100 | #22 | Exceptional 96.4% |
| Czechs | 100.0 /100 | #23 | Exceptional 96.4% |
| Latvians | 100.0 /100 | #24 | Exceptional 96.4% |
| French | 100.0 /100 | #25 | Exceptional 96.3% |
| French Canadians | 100.0 /100 | #26 | Exceptional 96.3% |
| Scotch-Irish | 100.0 /100 | #27 | Exceptional 96.3% |
| Eastern Europeans | 100.0 /100 | #28 | Exceptional 96.3% |
Demographics Similar to Thais by 9th Grade
In terms of 9th grade, the demographic groups most similar to Thais are Immigrants from Australia (95.8%, a difference of 0.010%), Immigrants from Belgium (95.8%, a difference of 0.010%), Turkish (95.8%, a difference of 0.010%), Immigrants from Singapore (95.8%, a difference of 0.010%), and Inupiat (95.8%, a difference of 0.010%).
| Demographics | Rating | Rank | 9th Grade |
| Cypriots | 99.6 /100 | #67 | Exceptional 95.8% |
| Immigrants | Ireland | 99.6 /100 | #68 | Exceptional 95.8% |
| Immigrants | Lithuania | 99.6 /100 | #69 | Exceptional 95.8% |
| Immigrants | Australia | 99.5 /100 | #70 | Exceptional 95.8% |
| Immigrants | Belgium | 99.5 /100 | #71 | Exceptional 95.8% |
| Turks | 99.5 /100 | #72 | Exceptional 95.8% |
| Immigrants | Singapore | 99.5 /100 | #73 | Exceptional 95.8% |
| Thais | 99.5 /100 | #74 | Exceptional 95.8% |
| Inupiat | 99.5 /100 | #75 | Exceptional 95.8% |
| Immigrants | Sweden | 99.5 /100 | #76 | Exceptional 95.8% |
| Whites/Caucasians | 99.4 /100 | #77 | Exceptional 95.8% |
| Immigrants | South Africa | 99.4 /100 | #78 | Exceptional 95.8% |
| Romanians | 99.3 /100 | #79 | Exceptional 95.7% |
| Bhutanese | 99.3 /100 | #80 | Exceptional 95.7% |
| Arapaho | 99.3 /100 | #81 | Exceptional 95.7% |