Alaskan Athabascan vs British 9th Grade
COMPARE
Alaskan Athabascan
British
9th Grade
9th Grade Comparison
Alaskan Athabascans
British
96.4%
9TH GRADE
100.0/ 100
METRIC RATING
21st/ 347
METRIC RANK
96.3%
9TH GRADE
100.0/ 100
METRIC RATING
31st/ 347
METRIC RANK
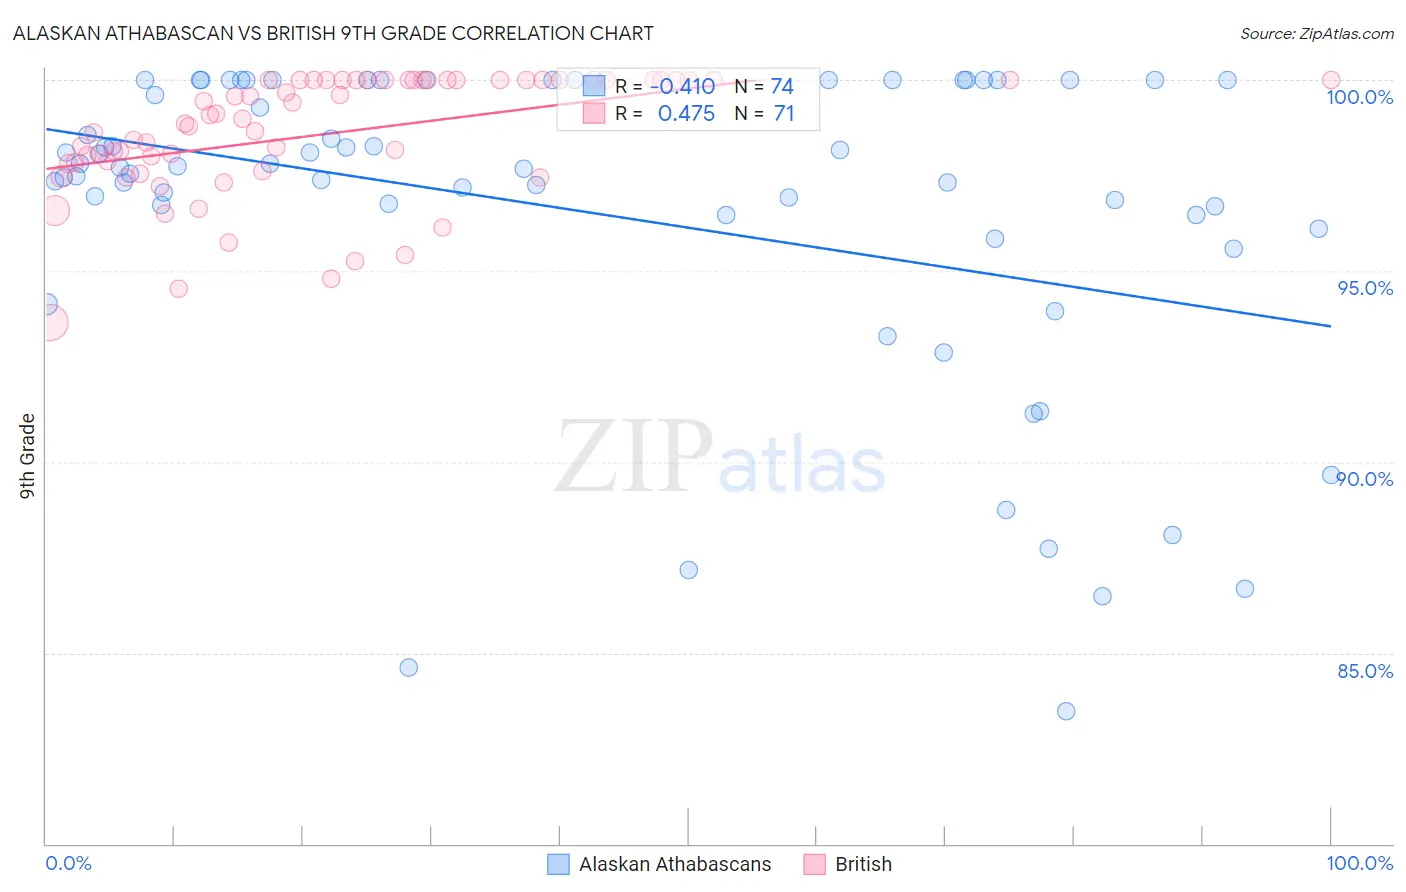
Alaskan Athabascan vs British 9th Grade Correlation Chart
The statistical analysis conducted on geographies consisting of 45,820,365 people shows a moderate negative correlation between the proportion of Alaskan Athabascans and percentage of population with at least 9th grade education in the United States with a correlation coefficient (R) of -0.410 and weighted average of 96.4%. Similarly, the statistical analysis conducted on geographies consisting of 531,463,107 people shows a moderate positive correlation between the proportion of British and percentage of population with at least 9th grade education in the United States with a correlation coefficient (R) of 0.475 and weighted average of 96.3%, a difference of 0.14%.
9th Grade Correlation Summary
| Measurement | Alaskan Athabascan | British |
| Minimum | 83.5% | 93.7% |
| Maximum | 100.0% | 100.0% |
| Range | 16.5% | 6.3% |
| Mean | 96.5% | 98.6% |
| Median | 97.7% | 99.0% |
| Interquartile 25% (IQ1) | 96.4% | 97.8% |
| Interquartile 75% (IQ3) | 100.0% | 100.0% |
| Interquartile Range (IQR) | 3.6% | 2.2% |
| Standard Deviation (Sample) | 4.2% | 1.6% |
| Standard Deviation (Population) | 4.1% | 1.6% |
Demographics Similar to Alaskan Athabascans and British by 9th Grade
In terms of 9th grade, the demographic groups most similar to Alaskan Athabascans are Italian (96.4%, a difference of 0.010%), European (96.4%, a difference of 0.010%), Welsh (96.4%, a difference of 0.020%), Czech (96.4%, a difference of 0.020%), and Scandinavian (96.5%, a difference of 0.050%). Similarly, the demographic groups most similar to British are Maltese (96.3%, a difference of 0.0%), Belgian (96.3%, a difference of 0.0%), Luxembourger (96.3%, a difference of 0.010%), Scotch-Irish (96.3%, a difference of 0.030%), and Eastern European (96.3%, a difference of 0.030%).
| Demographics | Rating | Rank | 9th Grade |
| Croatians | 100.0 /100 | #16 | Exceptional 96.5% |
| Dutch | 100.0 /100 | #17 | Exceptional 96.5% |
| Scandinavians | 100.0 /100 | #18 | Exceptional 96.5% |
| Welsh | 100.0 /100 | #19 | Exceptional 96.4% |
| Italians | 100.0 /100 | #20 | Exceptional 96.4% |
| Alaskan Athabascans | 100.0 /100 | #21 | Exceptional 96.4% |
| Europeans | 100.0 /100 | #22 | Exceptional 96.4% |
| Czechs | 100.0 /100 | #23 | Exceptional 96.4% |
| Latvians | 100.0 /100 | #24 | Exceptional 96.4% |
| French | 100.0 /100 | #25 | Exceptional 96.3% |
| French Canadians | 100.0 /100 | #26 | Exceptional 96.3% |
| Scotch-Irish | 100.0 /100 | #27 | Exceptional 96.3% |
| Eastern Europeans | 100.0 /100 | #28 | Exceptional 96.3% |
| Chinese | 100.0 /100 | #29 | Exceptional 96.3% |
| Maltese | 100.0 /100 | #30 | Exceptional 96.3% |
| British | 100.0 /100 | #31 | Exceptional 96.3% |
| Belgians | 100.0 /100 | #32 | Exceptional 96.3% |
| Luxembourgers | 100.0 /100 | #33 | Exceptional 96.3% |
| Hungarians | 100.0 /100 | #34 | Exceptional 96.2% |
| Bulgarians | 99.9 /100 | #35 | Exceptional 96.2% |
| Northern Europeans | 99.9 /100 | #36 | Exceptional 96.2% |