French American Indian vs Immigrants from Dominican Republic 9th Grade
COMPARE
French American Indian
Immigrants from Dominican Republic
9th Grade
9th Grade Comparison
French American Indians
Immigrants from Dominican Republic
95.0%
9TH GRADE
66.5/ 100
METRIC RATING
161st/ 347
METRIC RANK
90.5%
9TH GRADE
0.0/ 100
METRIC RATING
336th/ 347
METRIC RANK
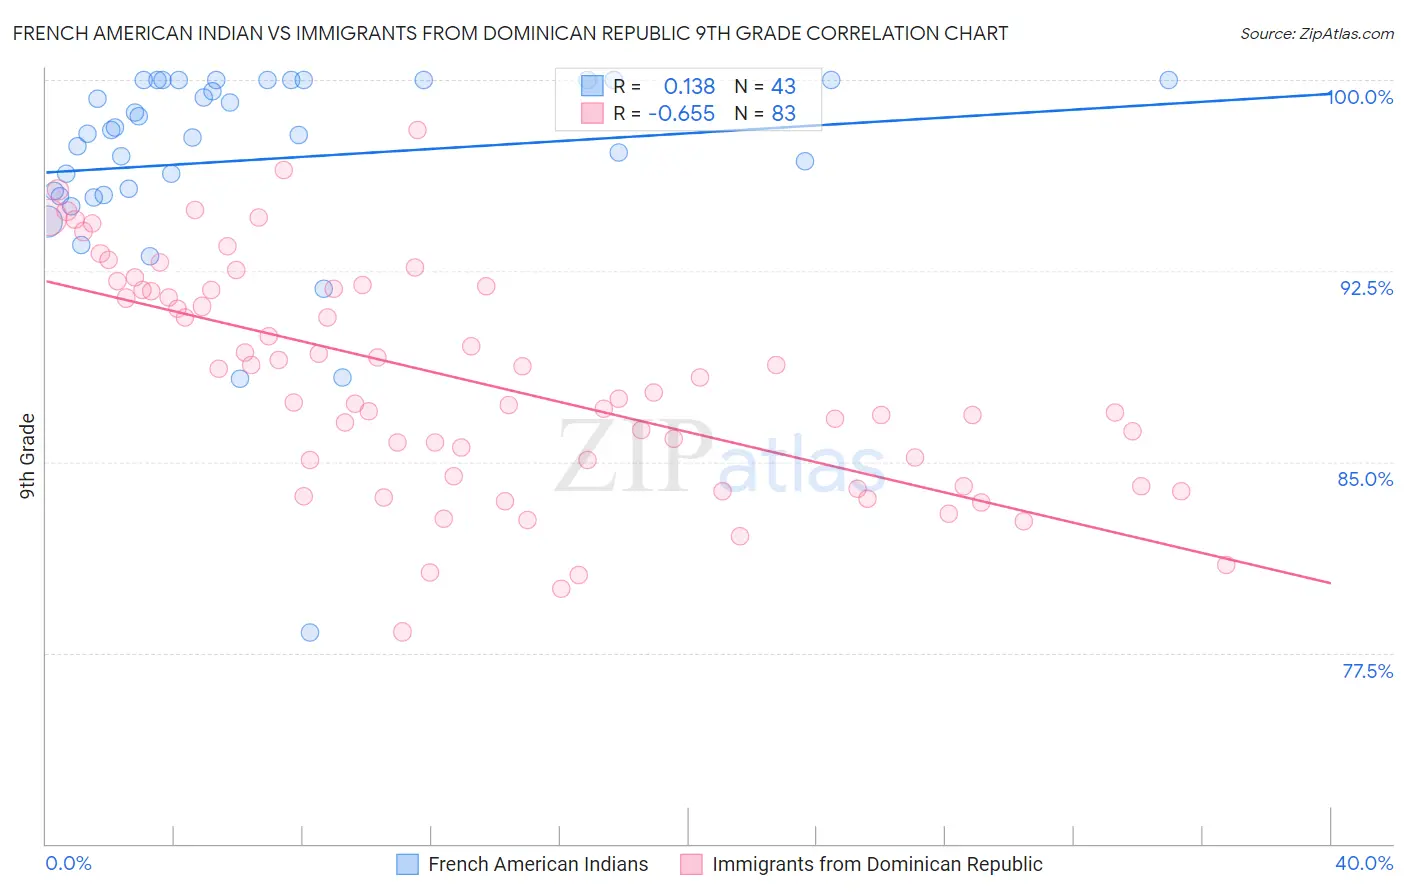
French American Indian vs Immigrants from Dominican Republic 9th Grade Correlation Chart
The statistical analysis conducted on geographies consisting of 131,976,269 people shows a poor positive correlation between the proportion of French American Indians and percentage of population with at least 9th grade education in the United States with a correlation coefficient (R) of 0.138 and weighted average of 95.0%. Similarly, the statistical analysis conducted on geographies consisting of 275,144,349 people shows a significant negative correlation between the proportion of Immigrants from Dominican Republic and percentage of population with at least 9th grade education in the United States with a correlation coefficient (R) of -0.655 and weighted average of 90.5%, a difference of 5.0%.
9th Grade Correlation Summary
| Measurement | French American Indian | Immigrants from Dominican Republic |
| Minimum | 78.3% | 78.3% |
| Maximum | 100.0% | 98.1% |
| Range | 21.7% | 19.7% |
| Mean | 96.9% | 88.2% |
| Median | 97.9% | 87.7% |
| Interquartile 25% (IQ1) | 95.5% | 84.5% |
| Interquartile 75% (IQ3) | 100.0% | 91.8% |
| Interquartile Range (IQR) | 4.5% | 7.3% |
| Standard Deviation (Sample) | 4.2% | 4.4% |
| Standard Deviation (Population) | 4.1% | 4.4% |
Similar Demographics by 9th Grade
Demographics Similar to French American Indians by 9th Grade
In terms of 9th grade, the demographic groups most similar to French American Indians are Immigrants from Italy (95.0%, a difference of 0.0%), Immigrants from Ukraine (95.0%, a difference of 0.010%), Bermudan (95.0%, a difference of 0.010%), Pakistani (95.0%, a difference of 0.020%), and Venezuelan (95.0%, a difference of 0.020%).
| Demographics | Rating | Rank | 9th Grade |
| Arabs | 74.9 /100 | #154 | Good 95.1% |
| Immigrants | Kazakhstan | 74.7 /100 | #155 | Good 95.1% |
| Immigrants | Kenya | 73.1 /100 | #156 | Good 95.0% |
| Mongolians | 73.0 /100 | #157 | Good 95.0% |
| Egyptians | 70.1 /100 | #158 | Good 95.0% |
| Immigrants | Ukraine | 67.4 /100 | #159 | Good 95.0% |
| Immigrants | Italy | 66.6 /100 | #160 | Good 95.0% |
| French American Indians | 66.5 /100 | #161 | Good 95.0% |
| Bermudans | 65.8 /100 | #162 | Good 95.0% |
| Pakistanis | 64.1 /100 | #163 | Good 95.0% |
| Venezuelans | 63.6 /100 | #164 | Good 95.0% |
| Blackfeet | 62.6 /100 | #165 | Good 95.0% |
| Ute | 62.6 /100 | #166 | Good 95.0% |
| Immigrants | Brazil | 61.1 /100 | #167 | Good 95.0% |
| Chileans | 60.7 /100 | #168 | Good 95.0% |
Demographics Similar to Immigrants from Dominican Republic by 9th Grade
In terms of 9th grade, the demographic groups most similar to Immigrants from Dominican Republic are Immigrants from Latin America (90.4%, a difference of 0.12%), Central American (90.4%, a difference of 0.13%), Immigrants from Honduras (90.6%, a difference of 0.14%), Immigrants from the Azores (90.8%, a difference of 0.31%), and Immigrants from Yemen (90.8%, a difference of 0.36%).
| Demographics | Rating | Rank | 9th Grade |
| Hondurans | 0.0 /100 | #329 | Tragic 91.0% |
| Immigrants | Cabo Verde | 0.0 /100 | #330 | Tragic 90.9% |
| Mexican American Indians | 0.0 /100 | #331 | Tragic 90.9% |
| Hispanics or Latinos | 0.0 /100 | #332 | Tragic 90.9% |
| Immigrants | Yemen | 0.0 /100 | #333 | Tragic 90.8% |
| Immigrants | Azores | 0.0 /100 | #334 | Tragic 90.8% |
| Immigrants | Honduras | 0.0 /100 | #335 | Tragic 90.6% |
| Immigrants | Dominican Republic | 0.0 /100 | #336 | Tragic 90.5% |
| Immigrants | Latin America | 0.0 /100 | #337 | Tragic 90.4% |
| Central Americans | 0.0 /100 | #338 | Tragic 90.4% |
| Yakama | 0.0 /100 | #339 | Tragic 90.1% |
| Mexicans | 0.0 /100 | #340 | Tragic 90.0% |
| Guatemalans | 0.0 /100 | #341 | Tragic 89.9% |
| Salvadorans | 0.0 /100 | #342 | Tragic 89.6% |
| Immigrants | Guatemala | 0.0 /100 | #343 | Tragic 89.4% |