Zimbabwean vs Immigrants from Syria Master's Degree
COMPARE
Zimbabwean
Immigrants from Syria
Master's Degree
Master's Degree Comparison
Zimbabweans
Immigrants from Syria
17.7%
MASTER'S DEGREE
99.7/ 100
METRIC RATING
73rd/ 347
METRIC RANK
16.2%
MASTER'S DEGREE
93.3/ 100
METRIC RATING
129th/ 347
METRIC RANK
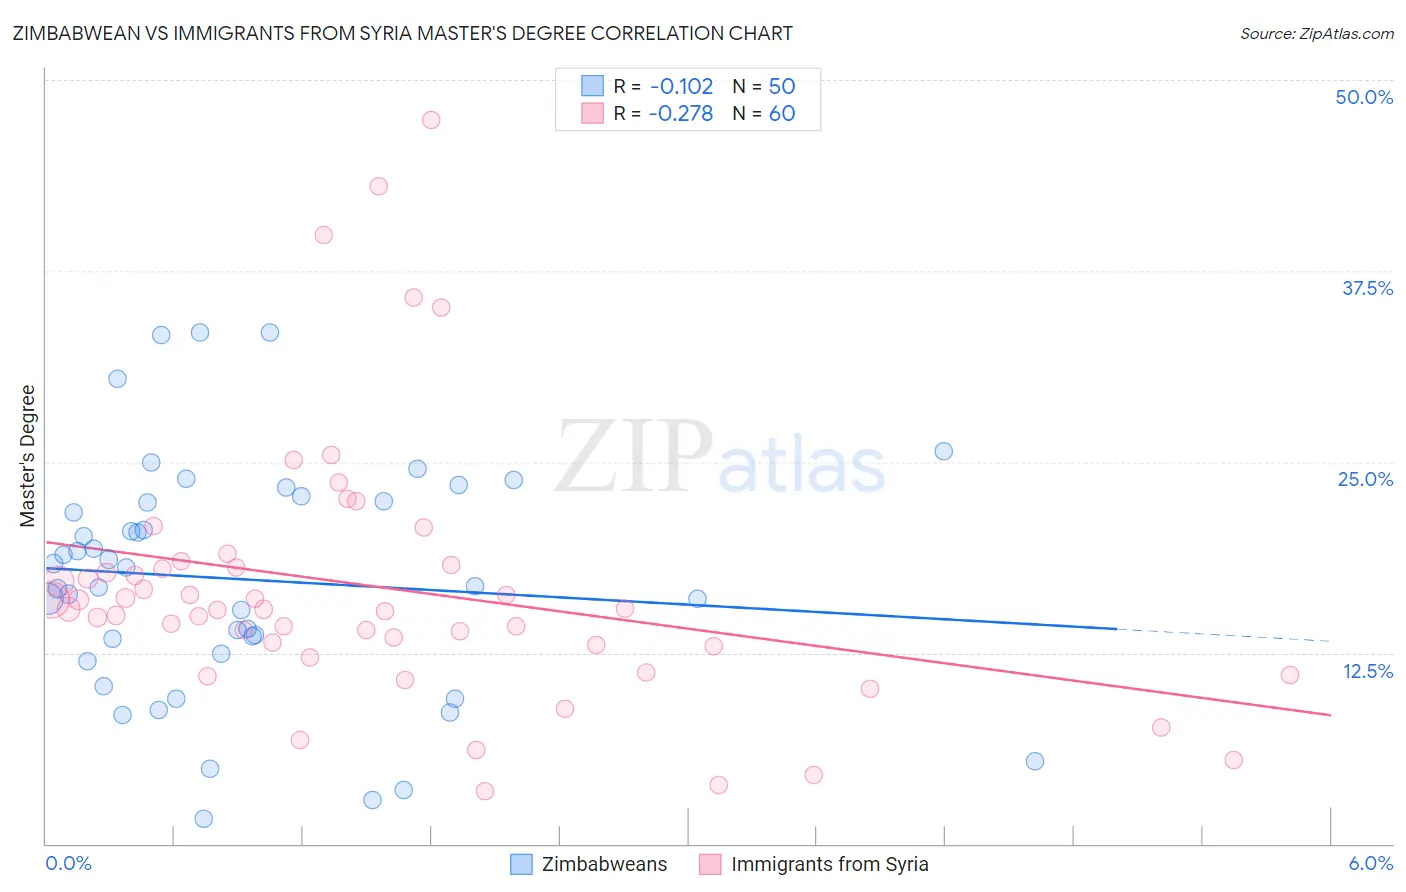
Zimbabwean vs Immigrants from Syria Master's Degree Correlation Chart
The statistical analysis conducted on geographies consisting of 69,201,212 people shows a poor negative correlation between the proportion of Zimbabweans and percentage of population with at least master's degree education in the United States with a correlation coefficient (R) of -0.102 and weighted average of 17.7%. Similarly, the statistical analysis conducted on geographies consisting of 174,107,928 people shows a weak negative correlation between the proportion of Immigrants from Syria and percentage of population with at least master's degree education in the United States with a correlation coefficient (R) of -0.278 and weighted average of 16.2%, a difference of 9.6%.
Master's Degree Correlation Summary
| Measurement | Zimbabwean | Immigrants from Syria |
| Minimum | 1.7% | 3.4% |
| Maximum | 33.5% | 47.4% |
| Range | 31.8% | 44.0% |
| Mean | 17.3% | 16.8% |
| Median | 17.5% | 15.3% |
| Interquartile 25% (IQ1) | 12.5% | 13.0% |
| Interquartile 75% (IQ3) | 22.4% | 18.2% |
| Interquartile Range (IQR) | 9.9% | 5.2% |
| Standard Deviation (Sample) | 7.7% | 8.7% |
| Standard Deviation (Population) | 7.6% | 8.6% |
Similar Demographics by Master's Degree
Demographics Similar to Zimbabweans by Master's Degree
In terms of master's degree, the demographic groups most similar to Zimbabweans are Lithuanian (17.7%, a difference of 0.11%), Immigrants from Pakistan (17.8%, a difference of 0.28%), Immigrants from Romania (17.7%, a difference of 0.31%), Immigrants from Western Europe (17.8%, a difference of 0.57%), and Egyptian (17.6%, a difference of 0.69%).
| Demographics | Rating | Rank | Master's Degree |
| Ethiopians | 99.8 /100 | #66 | Exceptional 18.0% |
| Immigrants | Argentina | 99.8 /100 | #67 | Exceptional 18.0% |
| Immigrants | Ethiopia | 99.8 /100 | #68 | Exceptional 17.9% |
| Immigrants | Uzbekistan | 99.8 /100 | #69 | Exceptional 17.9% |
| Immigrants | Western Europe | 99.8 /100 | #70 | Exceptional 17.8% |
| Immigrants | Pakistan | 99.7 /100 | #71 | Exceptional 17.8% |
| Lithuanians | 99.7 /100 | #72 | Exceptional 17.7% |
| Zimbabweans | 99.7 /100 | #73 | Exceptional 17.7% |
| Immigrants | Romania | 99.7 /100 | #74 | Exceptional 17.7% |
| Egyptians | 99.6 /100 | #75 | Exceptional 17.6% |
| Immigrants | Indonesia | 99.6 /100 | #76 | Exceptional 17.6% |
| Immigrants | Eastern Europe | 99.6 /100 | #77 | Exceptional 17.6% |
| Immigrants | Hungary | 99.6 /100 | #78 | Exceptional 17.5% |
| Immigrants | Lebanon | 99.6 /100 | #79 | Exceptional 17.5% |
| Carpatho Rusyns | 99.6 /100 | #80 | Exceptional 17.5% |
Demographics Similar to Immigrants from Syria by Master's Degree
In terms of master's degree, the demographic groups most similar to Immigrants from Syria are Immigrants from Jordan (16.1%, a difference of 0.26%), Taiwanese (16.1%, a difference of 0.58%), Serbian (16.1%, a difference of 0.67%), Immigrants from Sierra Leone (16.3%, a difference of 0.75%), and Palestinian (16.3%, a difference of 0.80%).
| Demographics | Rating | Rank | Master's Degree |
| British | 95.6 /100 | #122 | Exceptional 16.4% |
| Croatians | 95.6 /100 | #123 | Exceptional 16.4% |
| Immigrants | Eritrea | 95.5 /100 | #124 | Exceptional 16.4% |
| Italians | 95.4 /100 | #125 | Exceptional 16.4% |
| Immigrants | Eastern Africa | 95.2 /100 | #126 | Exceptional 16.3% |
| Palestinians | 94.8 /100 | #127 | Exceptional 16.3% |
| Immigrants | Sierra Leone | 94.7 /100 | #128 | Exceptional 16.3% |
| Immigrants | Syria | 93.3 /100 | #129 | Exceptional 16.2% |
| Immigrants | Jordan | 92.7 /100 | #130 | Exceptional 16.1% |
| Taiwanese | 91.9 /100 | #131 | Exceptional 16.1% |
| Serbians | 91.7 /100 | #132 | Exceptional 16.1% |
| Immigrants | Sudan | 90.2 /100 | #133 | Exceptional 16.0% |
| Venezuelans | 88.4 /100 | #134 | Excellent 15.9% |
| South American Indians | 88.4 /100 | #135 | Excellent 15.9% |
| Assyrians/Chaldeans/Syriacs | 86.8 /100 | #136 | Excellent 15.8% |