Alaska Native vs Immigrants from Syria Unemployment
COMPARE
Alaska Native
Immigrants from Syria
Unemployment
Unemployment Comparison
Alaska Natives
Immigrants from Syria
7.2%
UNEMPLOYMENT
0.0/ 100
METRIC RATING
329th/ 347
METRIC RANK
5.5%
UNEMPLOYMENT
4.8/ 100
METRIC RATING
233rd/ 347
METRIC RANK
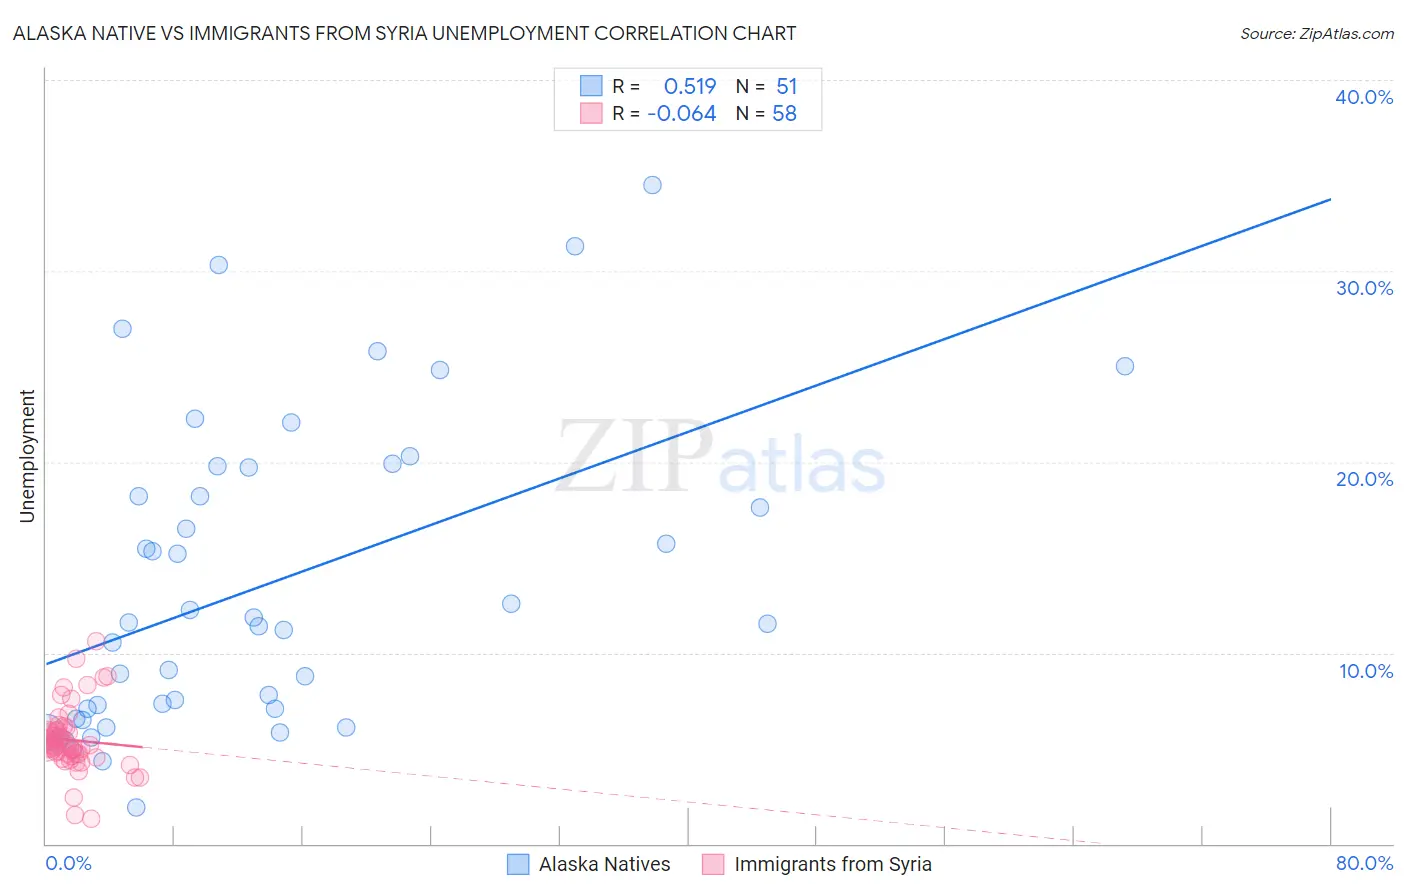
Alaska Native vs Immigrants from Syria Unemployment Correlation Chart
The statistical analysis conducted on geographies consisting of 76,749,531 people shows a substantial positive correlation between the proportion of Alaska Natives and unemployment in the United States with a correlation coefficient (R) of 0.519 and weighted average of 7.2%. Similarly, the statistical analysis conducted on geographies consisting of 173,974,388 people shows a slight negative correlation between the proportion of Immigrants from Syria and unemployment in the United States with a correlation coefficient (R) of -0.064 and weighted average of 5.5%, a difference of 31.6%.
Unemployment Correlation Summary
| Measurement | Alaska Native | Immigrants from Syria |
| Minimum | 1.9% | 1.3% |
| Maximum | 34.5% | 10.6% |
| Range | 32.6% | 9.3% |
| Mean | 13.5% | 5.4% |
| Median | 11.5% | 5.2% |
| Interquartile 25% (IQ1) | 6.6% | 4.7% |
| Interquartile 75% (IQ3) | 19.7% | 5.9% |
| Interquartile Range (IQR) | 13.1% | 1.2% |
| Standard Deviation (Sample) | 8.0% | 1.7% |
| Standard Deviation (Population) | 8.0% | 1.7% |
Similar Demographics by Unemployment
Demographics Similar to Alaska Natives by Unemployment
In terms of unemployment, the demographic groups most similar to Alaska Natives are Tsimshian (7.2%, a difference of 0.31%), Pueblo (7.2%, a difference of 1.2%), Yakama (7.3%, a difference of 1.3%), Dominican (7.4%, a difference of 1.6%), and Paiute (7.1%, a difference of 1.8%).
| Demographics | Rating | Rank | Unemployment |
| Guyanese | 0.0 /100 | #322 | Tragic 6.9% |
| Immigrants | Grenada | 0.0 /100 | #323 | Tragic 6.9% |
| Immigrants | Armenia | 0.0 /100 | #324 | Tragic 7.0% |
| Natives/Alaskans | 0.0 /100 | #325 | Tragic 7.0% |
| Paiute | 0.0 /100 | #326 | Tragic 7.1% |
| Pueblo | 0.0 /100 | #327 | Tragic 7.2% |
| Tsimshian | 0.0 /100 | #328 | Tragic 7.2% |
| Alaska Natives | 0.0 /100 | #329 | Tragic 7.2% |
| Yakama | 0.0 /100 | #330 | Tragic 7.3% |
| Dominicans | 0.0 /100 | #331 | Tragic 7.4% |
| Sioux | 0.0 /100 | #332 | Tragic 7.4% |
| Immigrants | Dominican Republic | 0.0 /100 | #333 | Tragic 7.4% |
| Apache | 0.0 /100 | #334 | Tragic 7.4% |
| Alaskan Athabascans | 0.0 /100 | #335 | Tragic 7.7% |
| Immigrants | Yemen | 0.0 /100 | #336 | Tragic 7.7% |
Demographics Similar to Immigrants from Syria by Unemployment
In terms of unemployment, the demographic groups most similar to Immigrants from Syria are Panamanian (5.5%, a difference of 0.030%), Immigrants from Africa (5.5%, a difference of 0.050%), Comanche (5.5%, a difference of 0.050%), Hawaiian (5.5%, a difference of 0.18%), and Ottawa (5.5%, a difference of 0.18%).
| Demographics | Rating | Rank | Unemployment |
| Samoans | 7.1 /100 | #226 | Tragic 5.5% |
| Immigrants | Lebanon | 7.0 /100 | #227 | Tragic 5.5% |
| Guamanians/Chamorros | 6.3 /100 | #228 | Tragic 5.5% |
| Hawaiians | 5.4 /100 | #229 | Tragic 5.5% |
| Ottawa | 5.4 /100 | #230 | Tragic 5.5% |
| Immigrants | Africa | 4.9 /100 | #231 | Tragic 5.5% |
| Comanche | 4.9 /100 | #232 | Tragic 5.5% |
| Immigrants | Syria | 4.8 /100 | #233 | Tragic 5.5% |
| Panamanians | 4.7 /100 | #234 | Tragic 5.5% |
| Immigrants | Panama | 3.4 /100 | #235 | Tragic 5.5% |
| Immigrants | Cambodia | 3.3 /100 | #236 | Tragic 5.5% |
| Moroccans | 3.2 /100 | #237 | Tragic 5.5% |
| Immigrants | Western Asia | 2.8 /100 | #238 | Tragic 5.5% |
| Immigrants | Immigrants | 2.6 /100 | #239 | Tragic 5.5% |
| Cree | 2.6 /100 | #240 | Tragic 5.6% |