Alaska Native vs Immigrants from France 11th Grade
COMPARE
Alaska Native
Immigrants from France
11th Grade
11th Grade Comparison
Alaska Natives
Immigrants from France
93.5%
11TH GRADE
98.4/ 100
METRIC RATING
108th/ 347
METRIC RANK
93.6%
11TH GRADE
99.0/ 100
METRIC RATING
95th/ 347
METRIC RANK
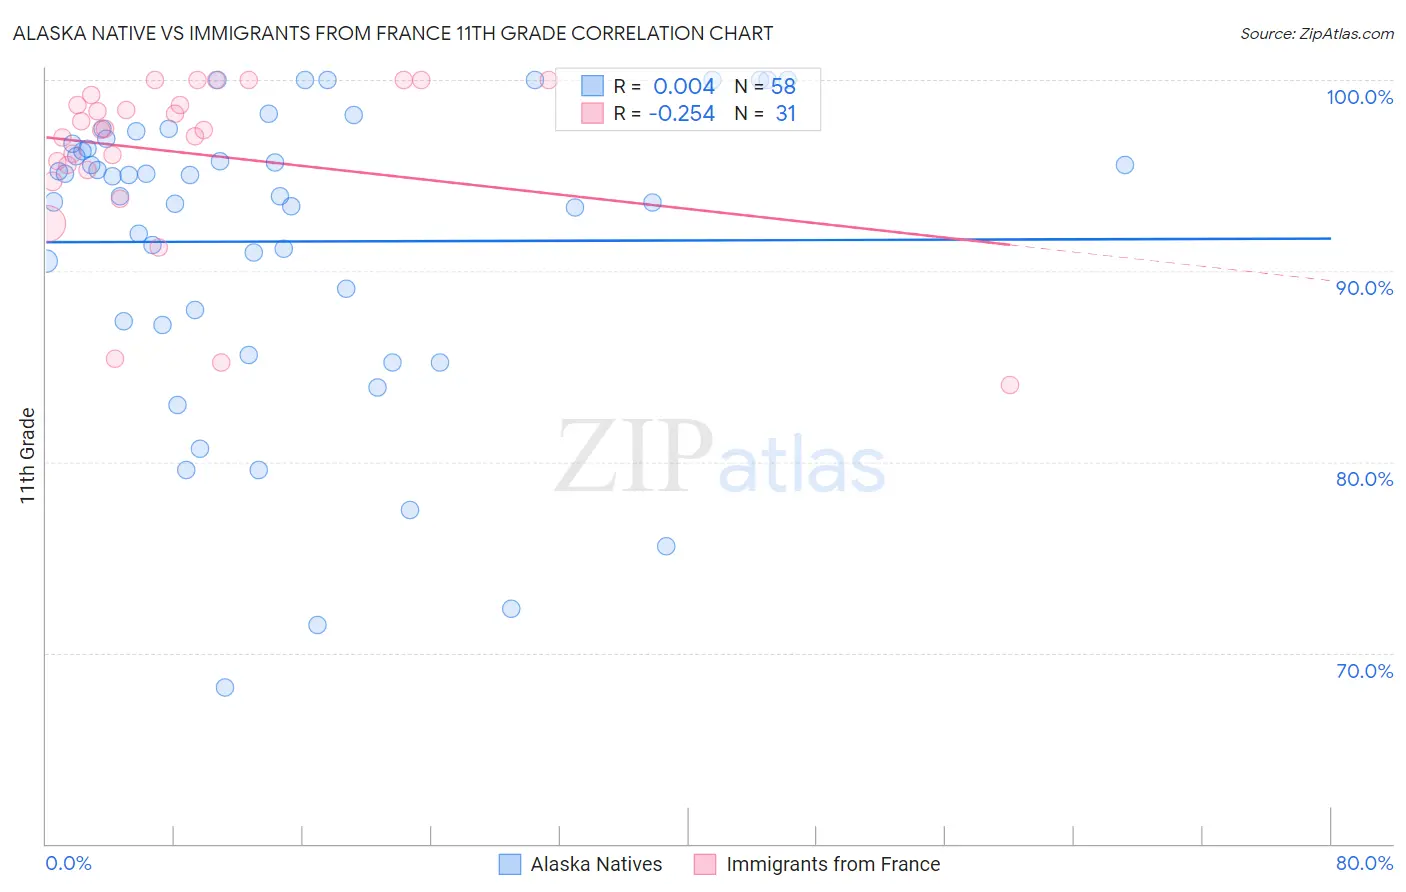
Alaska Native vs Immigrants from France 11th Grade Correlation Chart
The statistical analysis conducted on geographies consisting of 76,778,827 people shows no correlation between the proportion of Alaska Natives and percentage of population with at least 11th grade education in the United States with a correlation coefficient (R) of 0.004 and weighted average of 93.5%. Similarly, the statistical analysis conducted on geographies consisting of 287,920,906 people shows a weak negative correlation between the proportion of Immigrants from France and percentage of population with at least 11th grade education in the United States with a correlation coefficient (R) of -0.254 and weighted average of 93.6%, a difference of 0.11%.
11th Grade Correlation Summary
| Measurement | Alaska Native | Immigrants from France |
| Minimum | 68.2% | 84.0% |
| Maximum | 100.0% | 100.0% |
| Range | 31.8% | 16.0% |
| Mean | 91.5% | 96.2% |
| Median | 94.4% | 97.4% |
| Interquartile 25% (IQ1) | 87.4% | 95.3% |
| Interquartile 75% (IQ3) | 96.6% | 99.2% |
| Interquartile Range (IQR) | 9.3% | 3.9% |
| Standard Deviation (Sample) | 7.9% | 4.4% |
| Standard Deviation (Population) | 7.8% | 4.3% |
Demographics Similar to Alaska Natives and Immigrants from France by 11th Grade
In terms of 11th grade, the demographic groups most similar to Alaska Natives are Immigrants from Norway (93.5%, a difference of 0.0%), Immigrants from Kuwait (93.5%, a difference of 0.0%), Syrian (93.4%, a difference of 0.010%), Immigrants from Europe (93.5%, a difference of 0.020%), and Immigrants from Serbia (93.5%, a difference of 0.020%). Similarly, the demographic groups most similar to Immigrants from France are Swiss (93.6%, a difference of 0.0%), Puget Sound Salish (93.6%, a difference of 0.020%), Immigrants from Turkey (93.5%, a difference of 0.020%), Immigrants from Iran (93.5%, a difference of 0.030%), and South African (93.6%, a difference of 0.040%).
| Demographics | Rating | Rank | 11th Grade |
| South Africans | 99.2 /100 | #91 | Exceptional 93.6% |
| Immigrants | Bulgaria | 99.1 /100 | #92 | Exceptional 93.6% |
| Puget Sound Salish | 99.1 /100 | #93 | Exceptional 93.6% |
| Swiss | 99.0 /100 | #94 | Exceptional 93.6% |
| Immigrants | France | 99.0 /100 | #95 | Exceptional 93.6% |
| Immigrants | Turkey | 98.9 /100 | #96 | Exceptional 93.5% |
| Immigrants | Iran | 98.9 /100 | #97 | Exceptional 93.5% |
| Immigrants | Israel | 98.8 /100 | #98 | Exceptional 93.5% |
| Menominee | 98.7 /100 | #99 | Exceptional 93.5% |
| Immigrants | North Macedonia | 98.7 /100 | #100 | Exceptional 93.5% |
| Immigrants | Romania | 98.7 /100 | #101 | Exceptional 93.5% |
| Chippewa | 98.6 /100 | #102 | Exceptional 93.5% |
| Lebanese | 98.6 /100 | #103 | Exceptional 93.5% |
| Immigrants | Europe | 98.6 /100 | #104 | Exceptional 93.5% |
| Immigrants | Serbia | 98.6 /100 | #105 | Exceptional 93.5% |
| Immigrants | Croatia | 98.6 /100 | #106 | Exceptional 93.5% |
| Immigrants | Norway | 98.4 /100 | #107 | Exceptional 93.5% |
| Alaska Natives | 98.4 /100 | #108 | Exceptional 93.5% |
| Immigrants | Kuwait | 98.4 /100 | #109 | Exceptional 93.5% |
| Syrians | 98.4 /100 | #110 | Exceptional 93.4% |
| Yugoslavians | 98.1 /100 | #111 | Exceptional 93.4% |