Danish vs Immigrants from France 11th Grade
COMPARE
Danish
Immigrants from France
11th Grade
11th Grade Comparison
Danes
Immigrants from France
94.7%
11TH GRADE
100.0/ 100
METRIC RATING
9th/ 347
METRIC RANK
93.6%
11TH GRADE
99.0/ 100
METRIC RATING
95th/ 347
METRIC RANK
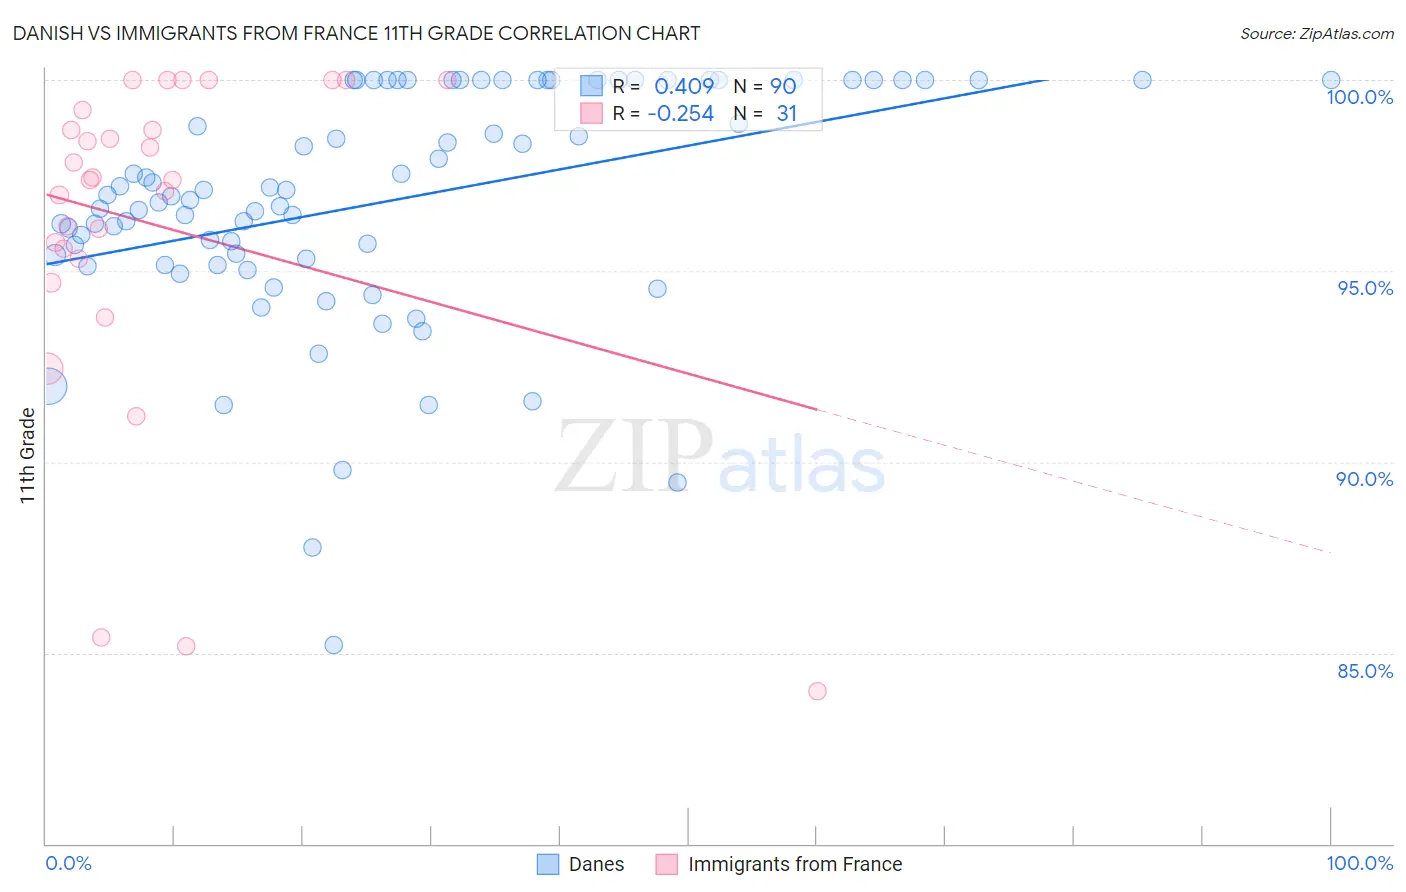
Danish vs Immigrants from France 11th Grade Correlation Chart
The statistical analysis conducted on geographies consisting of 474,193,674 people shows a moderate positive correlation between the proportion of Danes and percentage of population with at least 11th grade education in the United States with a correlation coefficient (R) of 0.409 and weighted average of 94.7%. Similarly, the statistical analysis conducted on geographies consisting of 287,920,906 people shows a weak negative correlation between the proportion of Immigrants from France and percentage of population with at least 11th grade education in the United States with a correlation coefficient (R) of -0.254 and weighted average of 93.6%, a difference of 1.2%.
11th Grade Correlation Summary
| Measurement | Danish | Immigrants from France |
| Minimum | 85.2% | 84.0% |
| Maximum | 100.0% | 100.0% |
| Range | 14.8% | 16.0% |
| Mean | 96.8% | 96.2% |
| Median | 97.0% | 97.4% |
| Interquartile 25% (IQ1) | 95.3% | 95.3% |
| Interquartile 75% (IQ3) | 100.0% | 99.2% |
| Interquartile Range (IQR) | 4.7% | 3.9% |
| Standard Deviation (Sample) | 3.1% | 4.4% |
| Standard Deviation (Population) | 3.0% | 4.3% |
Similar Demographics by 11th Grade
Demographics Similar to Danes by 11th Grade
In terms of 11th grade, the demographic groups most similar to Danes are Croatian (94.7%, a difference of 0.040%), Polish (94.8%, a difference of 0.050%), Finnish (94.7%, a difference of 0.050%), German (94.7%, a difference of 0.050%), and Latvian (94.7%, a difference of 0.050%).
| Demographics | Rating | Rank | 11th Grade |
| Swedes | 100.0 /100 | #2 | Exceptional 94.9% |
| Slovenes | 100.0 /100 | #3 | Exceptional 94.9% |
| Slovaks | 100.0 /100 | #4 | Exceptional 94.9% |
| Carpatho Rusyns | 100.0 /100 | #5 | Exceptional 94.8% |
| Lithuanians | 100.0 /100 | #6 | Exceptional 94.8% |
| Poles | 100.0 /100 | #7 | Exceptional 94.8% |
| Croatians | 100.0 /100 | #8 | Exceptional 94.7% |
| Danes | 100.0 /100 | #9 | Exceptional 94.7% |
| Finns | 100.0 /100 | #10 | Exceptional 94.7% |
| Germans | 100.0 /100 | #11 | Exceptional 94.7% |
| Latvians | 100.0 /100 | #12 | Exceptional 94.7% |
| Chinese | 100.0 /100 | #13 | Exceptional 94.6% |
| Eastern Europeans | 100.0 /100 | #14 | Exceptional 94.6% |
| Bulgarians | 100.0 /100 | #15 | Exceptional 94.5% |
| Immigrants | India | 100.0 /100 | #16 | Exceptional 94.5% |
Demographics Similar to Immigrants from France by 11th Grade
In terms of 11th grade, the demographic groups most similar to Immigrants from France are Swiss (93.6%, a difference of 0.0%), Puget Sound Salish (93.6%, a difference of 0.020%), Immigrants from Turkey (93.5%, a difference of 0.020%), Immigrants from Iran (93.5%, a difference of 0.030%), and South African (93.6%, a difference of 0.040%).
| Demographics | Rating | Rank | 11th Grade |
| Cambodians | 99.2 /100 | #88 | Exceptional 93.6% |
| Burmese | 99.2 /100 | #89 | Exceptional 93.6% |
| Ottawa | 99.2 /100 | #90 | Exceptional 93.6% |
| South Africans | 99.2 /100 | #91 | Exceptional 93.6% |
| Immigrants | Bulgaria | 99.1 /100 | #92 | Exceptional 93.6% |
| Puget Sound Salish | 99.1 /100 | #93 | Exceptional 93.6% |
| Swiss | 99.0 /100 | #94 | Exceptional 93.6% |
| Immigrants | France | 99.0 /100 | #95 | Exceptional 93.6% |
| Immigrants | Turkey | 98.9 /100 | #96 | Exceptional 93.5% |
| Immigrants | Iran | 98.9 /100 | #97 | Exceptional 93.5% |
| Immigrants | Israel | 98.8 /100 | #98 | Exceptional 93.5% |
| Menominee | 98.7 /100 | #99 | Exceptional 93.5% |
| Immigrants | North Macedonia | 98.7 /100 | #100 | Exceptional 93.5% |
| Immigrants | Romania | 98.7 /100 | #101 | Exceptional 93.5% |
| Chippewa | 98.6 /100 | #102 | Exceptional 93.5% |