Moroccan vs Immigrants from France 11th Grade

COMPARE

Moroccan
Race
Ancestry
AfghanAfricanAlaska NativeAlaskan AthabascanAlbanianAleutAlsatianAmericanApacheArabArapahoArgentineanArmenianAssyrian/Chaldean/SyriacAustralianAustrianBahamianBangladeshiBarbadianBasqueBelgianBelizeanBermudanBhutaneseBlackfeetBolivianBrazilianBritishBritish West IndianBulgarianBurmeseCajunCambodianCanadianCape VerdeanCarpatho RusynCelticCentral AmericanCentral American IndianCherokeeCheyenneChickasawChileanChineseChippewaChoctawColombianColvilleComancheCosta RicanCreeCreekCroatianCrowCubanCypriotCzechCzechoslovakianDanishDelawareDominicanDutchDutch West IndianEastern EuropeanEcuadorianEgyptianEnglishEstonianEthiopianEuropeanFijianFilipinoFinnishFrenchFrench American IndianFrench CanadianGermanGerman RussianGhanaianGreekGuamanian/ChamorroGuatemalanGuyaneseHaitianHmongHonduranHopiHoumaHungarianIcelanderIndian (Asian)IndonesianInupiatIranianIraqiIrishIroquoisIsraeliItalianJamaicanJapaneseJordanianKenyanKiowaKoreanLaotianLatvianLebaneseLiberianLithuanianLumbeeLuxembourgerMacedonianMalaysianMalteseMarshalleseMenomineeMexicanMexican American IndianMongolianMoroccanNative HawaiianNavajoNepaleseNew ZealanderNicaraguanNigerianNorthern EuropeanNorwegianOkinawanOsageOttawaPaiutePakistaniPalestinianPanamanianParaguayanPennsylvania GermanPeruvianPimaPolishPortuguesePotawatomiPuebloPuerto RicanPuget Sound SalishRomanianRussianSalvadoranSamoanScandinavianScotch-IrishScottishSeminoleSenegaleseSerbianShoshoneSierra LeoneanSiouxSlavicSlovakSloveneSomaliSouth AfricanSouth AmericanSouth American IndianSoviet UnionSpaniardSpanishSpanish AmericanSpanish American IndianSri LankanSubsaharan AfricanSudaneseSwedishSwissSyrianTaiwaneseThaiTlingit-HaidaTohono O'OdhamTonganTrinidadian and TobagonianTsimshianTurkishU.S. Virgin IslanderUgandanUkrainianUruguayanUteVenezuelanVietnameseWelshWest IndianYakamaYaquiYugoslavianYumanYup'ikZimbabwean
Immigration
NonimmigrantsImmigrantsAfghanistanAfricaAlbaniaArgentinaArmeniaAsiaAustraliaAustriaBahamasBangladeshBarbadosBelarusBelgiumBelizeBoliviaBosnia and HerzegovinaBrazilBulgariaBurma/MyanmarCabo VerdeCambodiaCameroonCanadaCaribbeanCentral AmericaChileChinaColombiaCongoCosta RicaCroatiaCubaCzechoslovakiaDenmarkDominicaDominican RepublicEastern AfricaEastern AsiaEastern EuropeEcuadorEgyptEl SalvadorEnglandEritreaEthiopiaEuropeFijiGermanyGhanaGreeceGrenadaGuatemalaGuyanaHaitiHondurasHong KongHungaryIndiaIndonesiaIranIraqIrelandIsraelItalyJamaicaJapanJordanKazakhstanKenyaKoreaKuwaitLaosLatin AmericaLatviaLebanonLiberiaLithuaniaMalaysiaMexicoMicronesiaMiddle AfricaMoldovaMoroccoNepalNetherlandsNicaraguaNigeriaNorth AmericaNorth MacedoniaNorthern AfricaNorthern EuropeNorwayOceaniaPakistanPanamaPeruPhilippinesPolandPortugalRomaniaRussiaSaudi ArabiaScotlandSenegalSerbiaSierra LeoneSingaporeSomaliaSouth AfricaSouth AmericaSouth Central AsiaSouth Eastern AsiaSouthern EuropeSpainSri LankaSt. Vincent and the GrenadinesSudanSwedenSwitzerlandSyriaTaiwanThailandTrinidad and TobagoTurkeyUgandaUkraineUruguayUzbekistanVenezuelaVietnamWest IndiesWestern AfricaWestern AsiaWestern EuropeYemenZaireZimbabweAzores
Immigrants from France
Race
Ancestry
AfghanAfricanAlaska NativeAlaskan AthabascanAlbanianAleutAlsatianAmericanApacheArabArapahoArgentineanArmenianAssyrian/Chaldean/SyriacAustralianAustrianBahamianBangladeshiBarbadianBasqueBelgianBelizeanBermudanBhutaneseBlackfeetBolivianBrazilianBritishBritish West IndianBulgarianBurmeseCajunCambodianCanadianCape VerdeanCarpatho RusynCelticCentral AmericanCentral American IndianCherokeeCheyenneChickasawChileanChineseChippewaChoctawColombianColvilleComancheCosta RicanCreeCreekCroatianCrowCubanCypriotCzechCzechoslovakianDanishDelawareDominicanDutchDutch West IndianEastern EuropeanEcuadorianEgyptianEnglishEstonianEthiopianEuropeanFijianFilipinoFinnishFrenchFrench American IndianFrench CanadianGermanGerman RussianGhanaianGreekGuamanian/ChamorroGuatemalanGuyaneseHaitianHmongHonduranHopiHoumaHungarianIcelanderIndian (Asian)IndonesianInupiatIranianIraqiIrishIroquoisIsraeliItalianJamaicanJapaneseJordanianKenyanKiowaKoreanLaotianLatvianLebaneseLiberianLithuanianLumbeeLuxembourgerMacedonianMalaysianMalteseMarshalleseMenomineeMexicanMexican American IndianMongolianNative HawaiianNavajoNepaleseNew ZealanderNicaraguanNigerianNorthern EuropeanNorwegianOkinawanOsageOttawaPaiutePakistaniPalestinianPanamanianParaguayanPennsylvania GermanPeruvianPimaPolishPortuguesePotawatomiPuebloPuerto RicanPuget Sound SalishRomanianRussianSalvadoranSamoanScandinavianScotch-IrishScottishSeminoleSenegaleseSerbianShoshoneSierra LeoneanSiouxSlavicSlovakSloveneSomaliSouth AfricanSouth AmericanSouth American IndianSoviet UnionSpaniardSpanishSpanish AmericanSpanish American IndianSri LankanSubsaharan AfricanSudaneseSwedishSwissSyrianTaiwaneseThaiTlingit-HaidaTohono O'OdhamTonganTrinidadian and TobagonianTsimshianTurkishU.S. Virgin IslanderUgandanUkrainianUruguayanUteVenezuelanVietnameseWelshWest IndianYakamaYaquiYugoslavianYumanYup'ikZimbabwean
Immigration
NonimmigrantsImmigrantsAfghanistanAfricaAlbaniaArgentinaArmeniaAsiaAustraliaAustriaBahamasBangladeshBarbadosBelarusBelgiumBelizeBoliviaBosnia and HerzegovinaBrazilBulgariaBurma/MyanmarCabo VerdeCambodiaCameroonCanadaCaribbeanCentral AmericaChileChinaColombiaCongoCosta RicaCroatiaCubaCzechoslovakiaDenmarkDominicaDominican RepublicEastern AfricaEastern AsiaEastern EuropeEcuadorEgyptEl SalvadorEnglandEritreaEthiopiaEuropeFijiFranceGermanyGhanaGreeceGrenadaGuatemalaGuyanaHaitiHondurasHong KongHungaryIndiaIndonesiaIranIraqIrelandIsraelItalyJamaicaJapanJordanKazakhstanKenyaKoreaKuwaitLaosLatin AmericaLatviaLebanonLiberiaLithuaniaMalaysiaMexicoMicronesiaMiddle AfricaMoldovaMoroccoNepalNetherlandsNicaraguaNigeriaNorth AmericaNorth MacedoniaNorthern AfricaNorthern EuropeNorwayOceaniaPakistanPanamaPeruPhilippinesPolandPortugalRomaniaRussiaSaudi ArabiaScotlandSenegalSerbiaSierra LeoneSingaporeSomaliaSouth AfricaSouth AmericaSouth Central AsiaSouth Eastern AsiaSouthern EuropeSpainSri LankaSt. Vincent and the GrenadinesSudanSwedenSwitzerlandSyriaTaiwanThailandTrinidad and TobagoTurkeyUgandaUkraineUruguayUzbekistanVenezuelaVietnamWest IndiesWestern AfricaWestern AsiaWestern EuropeYemenZaireZimbabweAzores
11th Grade
Income
Poverty
Unemployment
Labor Participation
Family Structure
Vehicle Availability
Education Level
Disability

11th Grade Comparison

Moroccans

Immigrants from France

Fair
Exceptional
92.3%
11TH GRADE
28.7/ 100
METRIC RATING
193rd/ 347
METRIC RANK
93.6%
11TH GRADE
99.0/ 100
METRIC RATING
95th/ 347
METRIC RANK

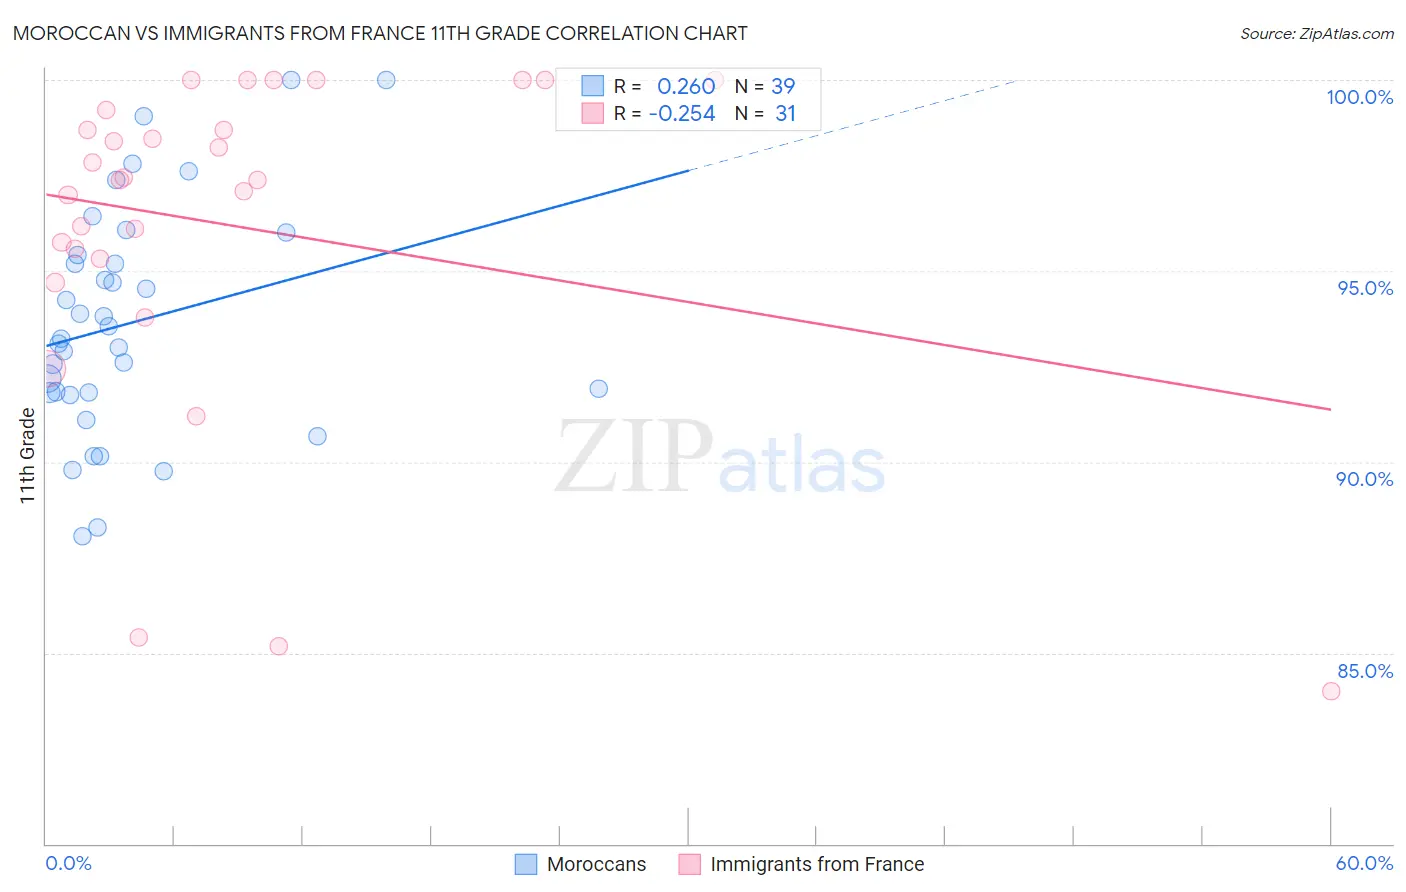
Moroccan vs Immigrants from France 11th Grade Correlation Chart

The statistical analysis conducted on geographies consisting of 201,817,667 people shows a weak positive correlation between the proportion of Moroccans and percentage of population with at least 11th grade education in the United States with a correlation coefficient (R) of 0.260 and weighted average of 92.3%. Similarly, the statistical analysis conducted on geographies consisting of 287,920,906 people shows a weak negative correlation between the proportion of Immigrants from France and percentage of population with at least 11th grade education in the United States with a correlation coefficient (R) of -0.254 and weighted average of 93.6%, a difference of 1.3%.
Moroccan vs Immigrants from France 11th Grade

11th Grade Correlation Summary

MeasurementMoroccanImmigrants from France
Minimum88.1%84.0%
Maximum100.0%100.0%
Range11.9%16.0%
Mean93.6%96.2%
Median93.2%97.4%
Interquartile 25% (IQ1)91.8%95.3%
Interquartile 75% (IQ3)95.4%99.2%
Interquartile Range (IQR)3.6%3.9%
Standard Deviation (Sample)3.0%4.4%
Standard Deviation (Population)3.0%4.3%

Similar Demographics by 11th Grade

Demographics Similar to Moroccans by 11th Grade

In terms of 11th grade, the demographic groups most similar to Moroccans are Sioux (92.3%, a difference of 0.0%), French American Indian (92.3%, a difference of 0.020%), Immigrants from Syria (92.3%, a difference of 0.020%), Liberian (92.3%, a difference of 0.020%), and Chickasaw (92.3%, a difference of 0.030%).
DemographicsRating | Rank11th Grade
Arapaho
35.1
/100
|
#186
Fair
92.4%
Immigrants | Western Asia
35.0
/100
|
#187
Fair
92.4%
Immigrants | Indonesia
33.7
/100
|
#188
Fair
92.4%
Immigrants | Chile
33.3
/100
|
#189
Fair
92.4%
Chickasaw
31.4
/100
|
#190
Fair
92.3%
French American Indians
30.8
/100
|
#191
Fair
92.3%
Immigrants | Syria
30.4
/100
|
#192
Fair
92.3%
Moroccans
28.7
/100
|
#193
Fair
92.3%
Sioux
28.5
/100
|
#194
Fair
92.3%
Liberians
26.8
/100
|
#195
Fair
92.3%
Panamanians
26.4
/100
|
#196
Fair
92.3%
Marshallese
26.0
/100
|
#197
Fair
92.3%
Hawaiians
25.5
/100
|
#198
Fair
92.3%
Immigrants | Uganda
25.2
/100
|
#199
Fair
92.3%
Samoans
25.1
/100
|
#200
Fair
92.3%

Demographics Similar to Immigrants from France by 11th Grade

In terms of 11th grade, the demographic groups most similar to Immigrants from France are Swiss (93.6%, a difference of 0.0%), Puget Sound Salish (93.6%, a difference of 0.020%), Immigrants from Turkey (93.5%, a difference of 0.020%), Immigrants from Iran (93.5%, a difference of 0.030%), and South African (93.6%, a difference of 0.040%).
DemographicsRating | Rank11th Grade
Cambodians
99.2
/100
|
#88
Exceptional
93.6%
Burmese
99.2
/100
|
#89
Exceptional
93.6%
Ottawa
99.2
/100
|
#90
Exceptional
93.6%
South Africans
99.2
/100
|
#91
Exceptional
93.6%
Immigrants | Bulgaria
99.1
/100
|
#92
Exceptional
93.6%
Puget Sound Salish
99.1
/100
|
#93
Exceptional
93.6%
Swiss
99.0
/100
|
#94
Exceptional
93.6%
Immigrants | France
99.0
/100
|
#95
Exceptional
93.6%
Immigrants | Turkey
98.9
/100
|
#96
Exceptional
93.5%
Immigrants | Iran
98.9
/100
|
#97
Exceptional
93.5%
Immigrants | Israel
98.8
/100
|
#98
Exceptional
93.5%
Menominee
98.7
/100
|
#99
Exceptional
93.5%
Immigrants | North Macedonia
98.7
/100
|
#100
Exceptional
93.5%
Immigrants | Romania
98.7
/100
|
#101
Exceptional
93.5%
Chippewa
98.6
/100
|
#102
Exceptional
93.5%