Alaska Native vs Panamanian 11th Grade
COMPARE
Alaska Native
Panamanian
11th Grade
11th Grade Comparison
Alaska Natives
Panamanians
93.5%
11TH GRADE
98.4/ 100
METRIC RATING
108th/ 347
METRIC RANK
92.3%
11TH GRADE
26.4/ 100
METRIC RATING
196th/ 347
METRIC RANK
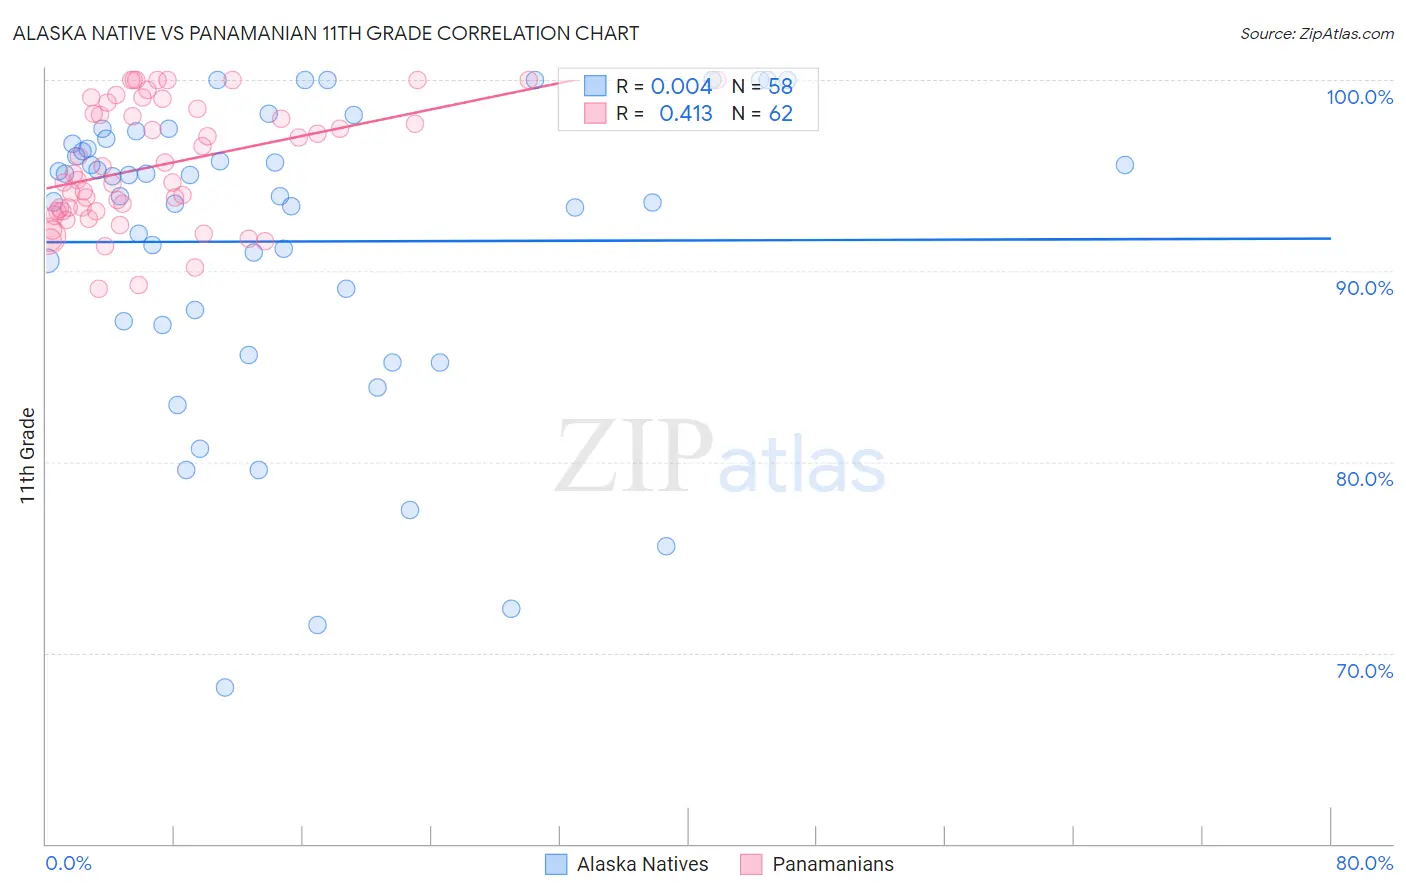
Alaska Native vs Panamanian 11th Grade Correlation Chart
The statistical analysis conducted on geographies consisting of 76,778,827 people shows no correlation between the proportion of Alaska Natives and percentage of population with at least 11th grade education in the United States with a correlation coefficient (R) of 0.004 and weighted average of 93.5%. Similarly, the statistical analysis conducted on geographies consisting of 281,248,945 people shows a moderate positive correlation between the proportion of Panamanians and percentage of population with at least 11th grade education in the United States with a correlation coefficient (R) of 0.413 and weighted average of 92.3%, a difference of 1.3%.
11th Grade Correlation Summary
| Measurement | Alaska Native | Panamanian |
| Minimum | 68.2% | 89.1% |
| Maximum | 100.0% | 100.0% |
| Range | 31.8% | 10.9% |
| Mean | 91.5% | 95.6% |
| Median | 94.4% | 94.9% |
| Interquartile 25% (IQ1) | 87.4% | 93.1% |
| Interquartile 75% (IQ3) | 96.6% | 98.5% |
| Interquartile Range (IQR) | 9.3% | 5.4% |
| Standard Deviation (Sample) | 7.9% | 3.2% |
| Standard Deviation (Population) | 7.8% | 3.1% |
Similar Demographics by 11th Grade
Demographics Similar to Alaska Natives by 11th Grade
In terms of 11th grade, the demographic groups most similar to Alaska Natives are Immigrants from Norway (93.5%, a difference of 0.0%), Immigrants from Kuwait (93.5%, a difference of 0.0%), Syrian (93.4%, a difference of 0.010%), Immigrants from Europe (93.5%, a difference of 0.020%), and Immigrants from Serbia (93.5%, a difference of 0.020%).
| Demographics | Rating | Rank | 11th Grade |
| Immigrants | Romania | 98.7 /100 | #101 | Exceptional 93.5% |
| Chippewa | 98.6 /100 | #102 | Exceptional 93.5% |
| Lebanese | 98.6 /100 | #103 | Exceptional 93.5% |
| Immigrants | Europe | 98.6 /100 | #104 | Exceptional 93.5% |
| Immigrants | Serbia | 98.6 /100 | #105 | Exceptional 93.5% |
| Immigrants | Croatia | 98.6 /100 | #106 | Exceptional 93.5% |
| Immigrants | Norway | 98.4 /100 | #107 | Exceptional 93.5% |
| Alaska Natives | 98.4 /100 | #108 | Exceptional 93.5% |
| Immigrants | Kuwait | 98.4 /100 | #109 | Exceptional 93.5% |
| Syrians | 98.4 /100 | #110 | Exceptional 93.4% |
| Yugoslavians | 98.1 /100 | #111 | Exceptional 93.4% |
| Immigrants | Germany | 98.0 /100 | #112 | Exceptional 93.4% |
| Immigrants | Zimbabwe | 97.8 /100 | #113 | Exceptional 93.4% |
| Jordanians | 97.8 /100 | #114 | Exceptional 93.4% |
| Palestinians | 97.7 /100 | #115 | Exceptional 93.4% |
Demographics Similar to Panamanians by 11th Grade
In terms of 11th grade, the demographic groups most similar to Panamanians are Liberian (92.3%, a difference of 0.010%), Marshallese (92.3%, a difference of 0.010%), Hawaiian (92.3%, a difference of 0.010%), Immigrants from Uganda (92.3%, a difference of 0.020%), and Samoan (92.3%, a difference of 0.020%).
| Demographics | Rating | Rank | 11th Grade |
| Immigrants | Chile | 33.3 /100 | #189 | Fair 92.4% |
| Chickasaw | 31.4 /100 | #190 | Fair 92.3% |
| French American Indians | 30.8 /100 | #191 | Fair 92.3% |
| Immigrants | Syria | 30.4 /100 | #192 | Fair 92.3% |
| Moroccans | 28.7 /100 | #193 | Fair 92.3% |
| Sioux | 28.5 /100 | #194 | Fair 92.3% |
| Liberians | 26.8 /100 | #195 | Fair 92.3% |
| Panamanians | 26.4 /100 | #196 | Fair 92.3% |
| Marshallese | 26.0 /100 | #197 | Fair 92.3% |
| Hawaiians | 25.5 /100 | #198 | Fair 92.3% |
| Immigrants | Uganda | 25.2 /100 | #199 | Fair 92.3% |
| Samoans | 25.1 /100 | #200 | Fair 92.3% |
| Immigrants | China | 25.1 /100 | #201 | Fair 92.3% |
| Immigrants | Eastern Africa | 24.1 /100 | #202 | Fair 92.3% |
| Immigrants | Sudan | 23.5 /100 | #203 | Fair 92.3% |