Cree vs Immigrants from France 11th Grade
COMPARE
Cree
Immigrants from France
11th Grade
11th Grade Comparison
Cree
Immigrants from France
92.9%
11TH GRADE
85.9/ 100
METRIC RATING
136th/ 347
METRIC RANK
93.6%
11TH GRADE
99.0/ 100
METRIC RATING
95th/ 347
METRIC RANK
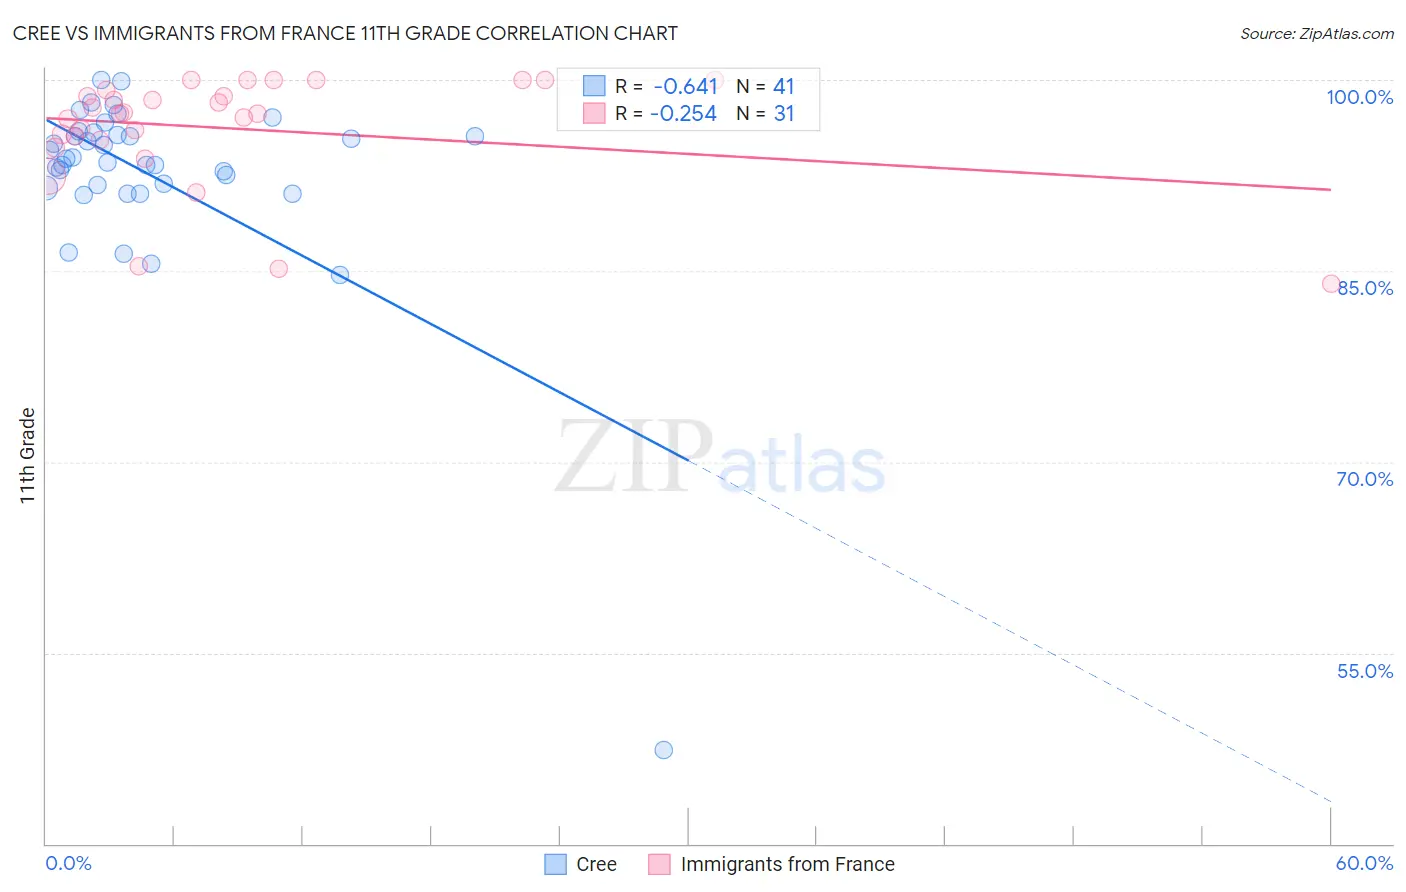
Cree vs Immigrants from France 11th Grade Correlation Chart
The statistical analysis conducted on geographies consisting of 76,211,744 people shows a significant negative correlation between the proportion of Cree and percentage of population with at least 11th grade education in the United States with a correlation coefficient (R) of -0.641 and weighted average of 92.9%. Similarly, the statistical analysis conducted on geographies consisting of 287,920,906 people shows a weak negative correlation between the proportion of Immigrants from France and percentage of population with at least 11th grade education in the United States with a correlation coefficient (R) of -0.254 and weighted average of 93.6%, a difference of 0.68%.
11th Grade Correlation Summary
| Measurement | Cree | Immigrants from France |
| Minimum | 47.4% | 84.0% |
| Maximum | 100.0% | 100.0% |
| Range | 52.6% | 16.0% |
| Mean | 92.6% | 96.2% |
| Median | 93.8% | 97.4% |
| Interquartile 25% (IQ1) | 91.6% | 95.3% |
| Interquartile 75% (IQ3) | 95.8% | 99.2% |
| Interquartile Range (IQR) | 4.2% | 3.9% |
| Standard Deviation (Sample) | 8.1% | 4.4% |
| Standard Deviation (Population) | 8.0% | 4.3% |
Similar Demographics by 11th Grade
Demographics Similar to Cree by 11th Grade
In terms of 11th grade, the demographic groups most similar to Cree are Immigrants from Italy (92.9%, a difference of 0.010%), Arab (92.9%, a difference of 0.010%), Immigrants from Brazil (92.9%, a difference of 0.020%), Mongolian (93.0%, a difference of 0.030%), and Delaware (93.0%, a difference of 0.030%).
| Demographics | Rating | Rank | 11th Grade |
| Immigrants | Ukraine | 89.8 /100 | #129 | Excellent 93.0% |
| Albanians | 89.5 /100 | #130 | Excellent 93.0% |
| Egyptians | 89.5 /100 | #131 | Excellent 93.0% |
| Immigrants | Bosnia and Herzegovina | 89.0 /100 | #132 | Excellent 93.0% |
| Mongolians | 87.6 /100 | #133 | Excellent 93.0% |
| Delaware | 87.3 /100 | #134 | Excellent 93.0% |
| Immigrants | Italy | 86.6 /100 | #135 | Excellent 92.9% |
| Cree | 85.9 /100 | #136 | Excellent 92.9% |
| Arabs | 85.4 /100 | #137 | Excellent 92.9% |
| Immigrants | Brazil | 85.1 /100 | #138 | Excellent 92.9% |
| Crow | 84.1 /100 | #139 | Excellent 92.9% |
| Venezuelans | 83.4 /100 | #140 | Excellent 92.9% |
| Chileans | 83.0 /100 | #141 | Excellent 92.9% |
| Kenyans | 82.0 /100 | #142 | Excellent 92.9% |
| Ugandans | 81.4 /100 | #143 | Excellent 92.9% |
Demographics Similar to Immigrants from France by 11th Grade
In terms of 11th grade, the demographic groups most similar to Immigrants from France are Swiss (93.6%, a difference of 0.0%), Puget Sound Salish (93.6%, a difference of 0.020%), Immigrants from Turkey (93.5%, a difference of 0.020%), Immigrants from Iran (93.5%, a difference of 0.030%), and South African (93.6%, a difference of 0.040%).
| Demographics | Rating | Rank | 11th Grade |
| Cambodians | 99.2 /100 | #88 | Exceptional 93.6% |
| Burmese | 99.2 /100 | #89 | Exceptional 93.6% |
| Ottawa | 99.2 /100 | #90 | Exceptional 93.6% |
| South Africans | 99.2 /100 | #91 | Exceptional 93.6% |
| Immigrants | Bulgaria | 99.1 /100 | #92 | Exceptional 93.6% |
| Puget Sound Salish | 99.1 /100 | #93 | Exceptional 93.6% |
| Swiss | 99.0 /100 | #94 | Exceptional 93.6% |
| Immigrants | France | 99.0 /100 | #95 | Exceptional 93.6% |
| Immigrants | Turkey | 98.9 /100 | #96 | Exceptional 93.5% |
| Immigrants | Iran | 98.9 /100 | #97 | Exceptional 93.5% |
| Immigrants | Israel | 98.8 /100 | #98 | Exceptional 93.5% |
| Menominee | 98.7 /100 | #99 | Exceptional 93.5% |
| Immigrants | North Macedonia | 98.7 /100 | #100 | Exceptional 93.5% |
| Immigrants | Romania | 98.7 /100 | #101 | Exceptional 93.5% |
| Chippewa | 98.6 /100 | #102 | Exceptional 93.5% |