Bolivian vs Immigrants from France 11th Grade
COMPARE
Bolivian
Immigrants from France
11th Grade
11th Grade Comparison
Bolivians
Immigrants from France
92.2%
11TH GRADE
23.2/ 100
METRIC RATING
206th/ 347
METRIC RANK
93.6%
11TH GRADE
99.0/ 100
METRIC RATING
95th/ 347
METRIC RANK
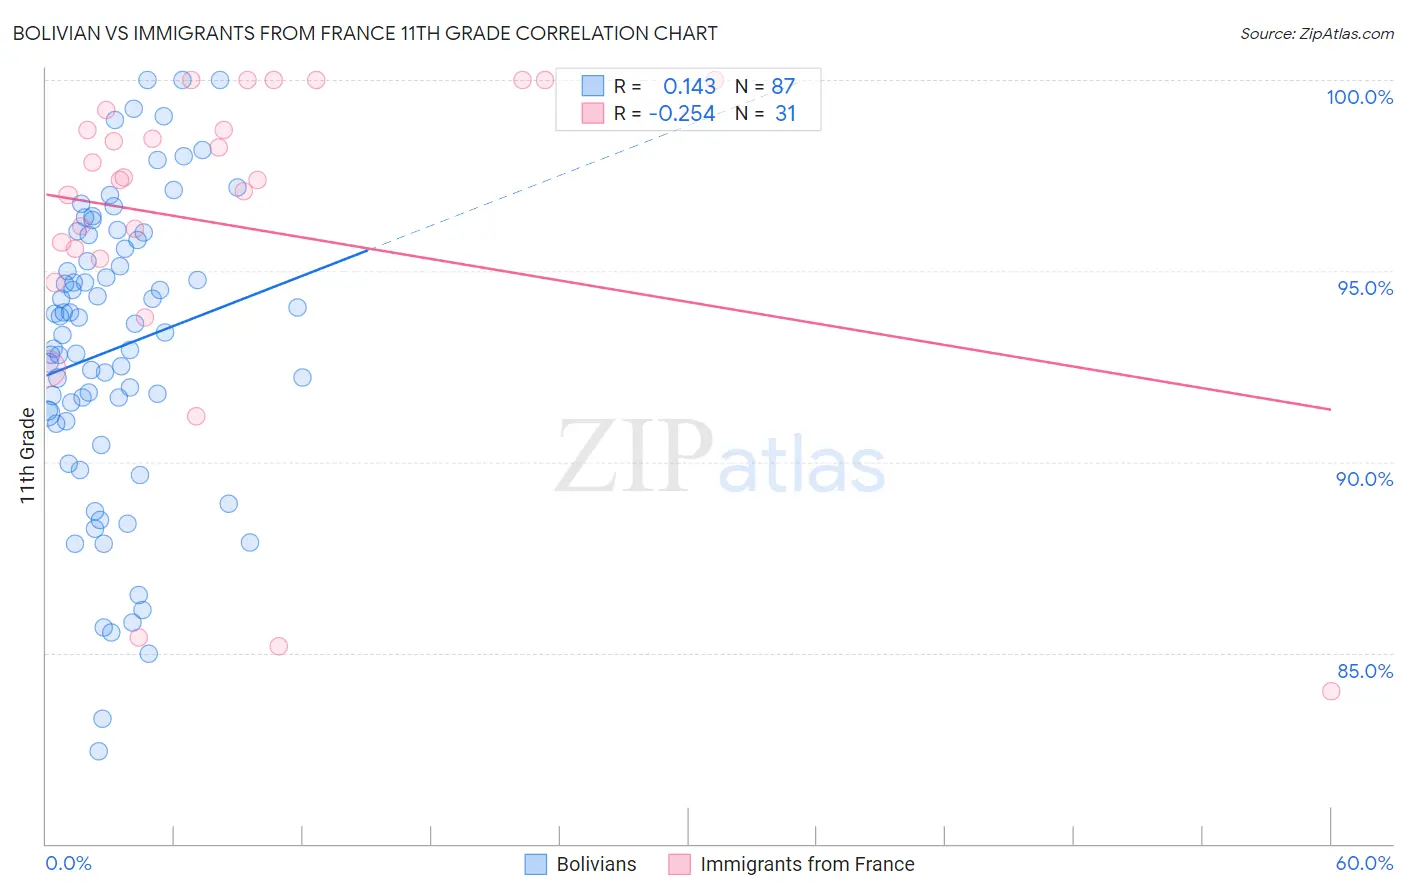
Bolivian vs Immigrants from France 11th Grade Correlation Chart
The statistical analysis conducted on geographies consisting of 184,666,822 people shows a poor positive correlation between the proportion of Bolivians and percentage of population with at least 11th grade education in the United States with a correlation coefficient (R) of 0.143 and weighted average of 92.2%. Similarly, the statistical analysis conducted on geographies consisting of 287,920,906 people shows a weak negative correlation between the proportion of Immigrants from France and percentage of population with at least 11th grade education in the United States with a correlation coefficient (R) of -0.254 and weighted average of 93.6%, a difference of 1.4%.
11th Grade Correlation Summary
| Measurement | Bolivian | Immigrants from France |
| Minimum | 82.4% | 84.0% |
| Maximum | 100.0% | 100.0% |
| Range | 17.6% | 16.0% |
| Mean | 93.0% | 96.2% |
| Median | 93.4% | 97.4% |
| Interquartile 25% (IQ1) | 91.1% | 95.3% |
| Interquartile 75% (IQ3) | 95.8% | 99.2% |
| Interquartile Range (IQR) | 4.7% | 3.9% |
| Standard Deviation (Sample) | 3.9% | 4.4% |
| Standard Deviation (Population) | 3.9% | 4.3% |
Similar Demographics by 11th Grade
Demographics Similar to Bolivians by 11th Grade
In terms of 11th grade, the demographic groups most similar to Bolivians are Immigrants from Sudan (92.3%, a difference of 0.0%), Immigrants from Hong Kong (92.2%, a difference of 0.0%), Kiowa (92.2%, a difference of 0.0%), Immigrants from Eastern Africa (92.3%, a difference of 0.010%), and Immigrants from Oceania (92.2%, a difference of 0.010%).
| Demographics | Rating | Rank | 11th Grade |
| Immigrants | Uganda | 25.2 /100 | #199 | Fair 92.3% |
| Samoans | 25.1 /100 | #200 | Fair 92.3% |
| Immigrants | China | 25.1 /100 | #201 | Fair 92.3% |
| Immigrants | Eastern Africa | 24.1 /100 | #202 | Fair 92.3% |
| Immigrants | Sudan | 23.5 /100 | #203 | Fair 92.3% |
| Immigrants | Hong Kong | 23.3 /100 | #204 | Fair 92.2% |
| Kiowa | 23.2 /100 | #205 | Fair 92.2% |
| Bolivians | 23.2 /100 | #206 | Fair 92.2% |
| Immigrants | Oceania | 22.4 /100 | #207 | Fair 92.2% |
| Colville | 21.8 /100 | #208 | Fair 92.2% |
| Tongans | 19.8 /100 | #209 | Poor 92.2% |
| Ethiopians | 18.8 /100 | #210 | Poor 92.2% |
| Immigrants | Micronesia | 17.7 /100 | #211 | Poor 92.2% |
| Koreans | 14.4 /100 | #212 | Poor 92.1% |
| Immigrants | Ethiopia | 13.9 /100 | #213 | Poor 92.1% |
Demographics Similar to Immigrants from France by 11th Grade
In terms of 11th grade, the demographic groups most similar to Immigrants from France are Swiss (93.6%, a difference of 0.0%), Puget Sound Salish (93.6%, a difference of 0.020%), Immigrants from Turkey (93.5%, a difference of 0.020%), Immigrants from Iran (93.5%, a difference of 0.030%), and South African (93.6%, a difference of 0.040%).
| Demographics | Rating | Rank | 11th Grade |
| Cambodians | 99.2 /100 | #88 | Exceptional 93.6% |
| Burmese | 99.2 /100 | #89 | Exceptional 93.6% |
| Ottawa | 99.2 /100 | #90 | Exceptional 93.6% |
| South Africans | 99.2 /100 | #91 | Exceptional 93.6% |
| Immigrants | Bulgaria | 99.1 /100 | #92 | Exceptional 93.6% |
| Puget Sound Salish | 99.1 /100 | #93 | Exceptional 93.6% |
| Swiss | 99.0 /100 | #94 | Exceptional 93.6% |
| Immigrants | France | 99.0 /100 | #95 | Exceptional 93.6% |
| Immigrants | Turkey | 98.9 /100 | #96 | Exceptional 93.5% |
| Immigrants | Iran | 98.9 /100 | #97 | Exceptional 93.5% |
| Immigrants | Israel | 98.8 /100 | #98 | Exceptional 93.5% |
| Menominee | 98.7 /100 | #99 | Exceptional 93.5% |
| Immigrants | North Macedonia | 98.7 /100 | #100 | Exceptional 93.5% |
| Immigrants | Romania | 98.7 /100 | #101 | Exceptional 93.5% |
| Chippewa | 98.6 /100 | #102 | Exceptional 93.5% |