Samoan vs Immigrants from Canada Master's Degree
COMPARE
Samoan
Immigrants from Canada
Master's Degree
Master's Degree Comparison
Samoans
Immigrants from Canada
11.5%
MASTER'S DEGREE
0.1/ 100
METRIC RATING
298th/ 347
METRIC RANK
17.2%
MASTER'S DEGREE
99.2/ 100
METRIC RATING
88th/ 347
METRIC RANK
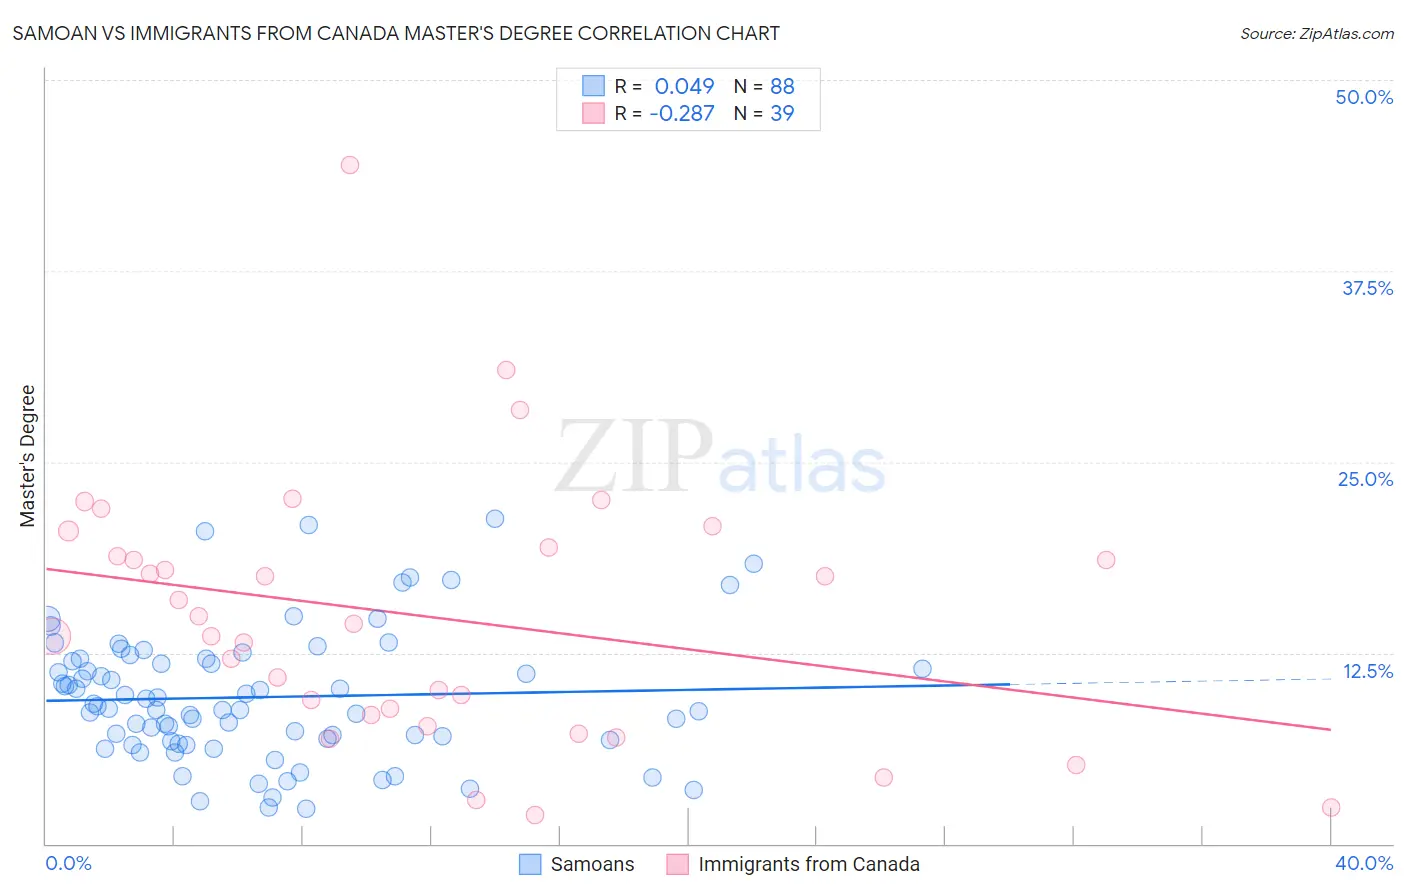
Samoan vs Immigrants from Canada Master's Degree Correlation Chart
The statistical analysis conducted on geographies consisting of 225,135,673 people shows no correlation between the proportion of Samoans and percentage of population with at least master's degree education in the United States with a correlation coefficient (R) of 0.049 and weighted average of 11.5%. Similarly, the statistical analysis conducted on geographies consisting of 459,222,681 people shows a weak negative correlation between the proportion of Immigrants from Canada and percentage of population with at least master's degree education in the United States with a correlation coefficient (R) of -0.287 and weighted average of 17.2%, a difference of 49.9%.
Master's Degree Correlation Summary
| Measurement | Samoan | Immigrants from Canada |
| Minimum | 2.3% | 1.9% |
| Maximum | 21.3% | 44.5% |
| Range | 19.0% | 42.5% |
| Mean | 9.6% | 14.9% |
| Median | 8.9% | 14.4% |
| Interquartile 25% (IQ1) | 6.7% | 8.4% |
| Interquartile 75% (IQ3) | 12.0% | 19.4% |
| Interquartile Range (IQR) | 5.3% | 11.0% |
| Standard Deviation (Sample) | 4.2% | 8.6% |
| Standard Deviation (Population) | 4.2% | 8.5% |
Similar Demographics by Master's Degree
Demographics Similar to Samoans by Master's Degree
In terms of master's degree, the demographic groups most similar to Samoans are Chickasaw (11.4%, a difference of 0.46%), Chippewa (11.4%, a difference of 0.48%), Tsimshian (11.4%, a difference of 0.64%), Immigrants from Yemen (11.6%, a difference of 0.71%), and Marshallese (11.6%, a difference of 0.84%).
| Demographics | Rating | Rank | Master's Degree |
| Colville | 0.1 /100 | #291 | Tragic 11.6% |
| Immigrants | Guatemala | 0.1 /100 | #292 | Tragic 11.6% |
| Alaska Natives | 0.1 /100 | #293 | Tragic 11.6% |
| Hawaiians | 0.1 /100 | #294 | Tragic 11.6% |
| Marshallese | 0.1 /100 | #295 | Tragic 11.6% |
| Alaskan Athabascans | 0.1 /100 | #296 | Tragic 11.6% |
| Immigrants | Yemen | 0.1 /100 | #297 | Tragic 11.6% |
| Samoans | 0.1 /100 | #298 | Tragic 11.5% |
| Chickasaw | 0.1 /100 | #299 | Tragic 11.4% |
| Chippewa | 0.1 /100 | #300 | Tragic 11.4% |
| Tsimshian | 0.1 /100 | #301 | Tragic 11.4% |
| Cherokee | 0.1 /100 | #302 | Tragic 11.4% |
| Immigrants | Laos | 0.1 /100 | #303 | Tragic 11.4% |
| Immigrants | Cabo Verde | 0.1 /100 | #304 | Tragic 11.3% |
| Immigrants | Latin America | 0.0 /100 | #305 | Tragic 11.3% |
Demographics Similar to Immigrants from Canada by Master's Degree
In terms of master's degree, the demographic groups most similar to Immigrants from Canada are Bhutanese (17.2%, a difference of 0.070%), Immigrants from Egypt (17.2%, a difference of 0.090%), Romanian (17.2%, a difference of 0.16%), Immigrants from North America (17.2%, a difference of 0.21%), and Immigrants from Italy (17.2%, a difference of 0.27%).
| Demographics | Rating | Rank | Master's Degree |
| Immigrants | Western Asia | 99.5 /100 | #81 | Exceptional 17.5% |
| Greeks | 99.5 /100 | #82 | Exceptional 17.5% |
| Immigrants | Zimbabwe | 99.5 /100 | #83 | Exceptional 17.4% |
| Immigrants | Scotland | 99.4 /100 | #84 | Exceptional 17.4% |
| Immigrants | Brazil | 99.4 /100 | #85 | Exceptional 17.4% |
| Immigrants | Croatia | 99.3 /100 | #86 | Exceptional 17.3% |
| Maltese | 99.3 /100 | #87 | Exceptional 17.3% |
| Immigrants | Canada | 99.2 /100 | #88 | Exceptional 17.2% |
| Bhutanese | 99.1 /100 | #89 | Exceptional 17.2% |
| Immigrants | Egypt | 99.1 /100 | #90 | Exceptional 17.2% |
| Romanians | 99.1 /100 | #91 | Exceptional 17.2% |
| Immigrants | North America | 99.1 /100 | #92 | Exceptional 17.2% |
| Immigrants | Italy | 99.1 /100 | #93 | Exceptional 17.2% |
| Ugandans | 99.0 /100 | #94 | Exceptional 17.1% |
| Immigrants | Morocco | 98.9 /100 | #95 | Exceptional 17.1% |