Apache vs Immigrants from Canada Master's Degree
COMPARE
Apache
Immigrants from Canada
Master's Degree
Master's Degree Comparison
Apache
Immigrants from Canada
11.0%
MASTER'S DEGREE
0.0/ 100
METRIC RATING
315th/ 347
METRIC RANK
17.2%
MASTER'S DEGREE
99.2/ 100
METRIC RATING
88th/ 347
METRIC RANK
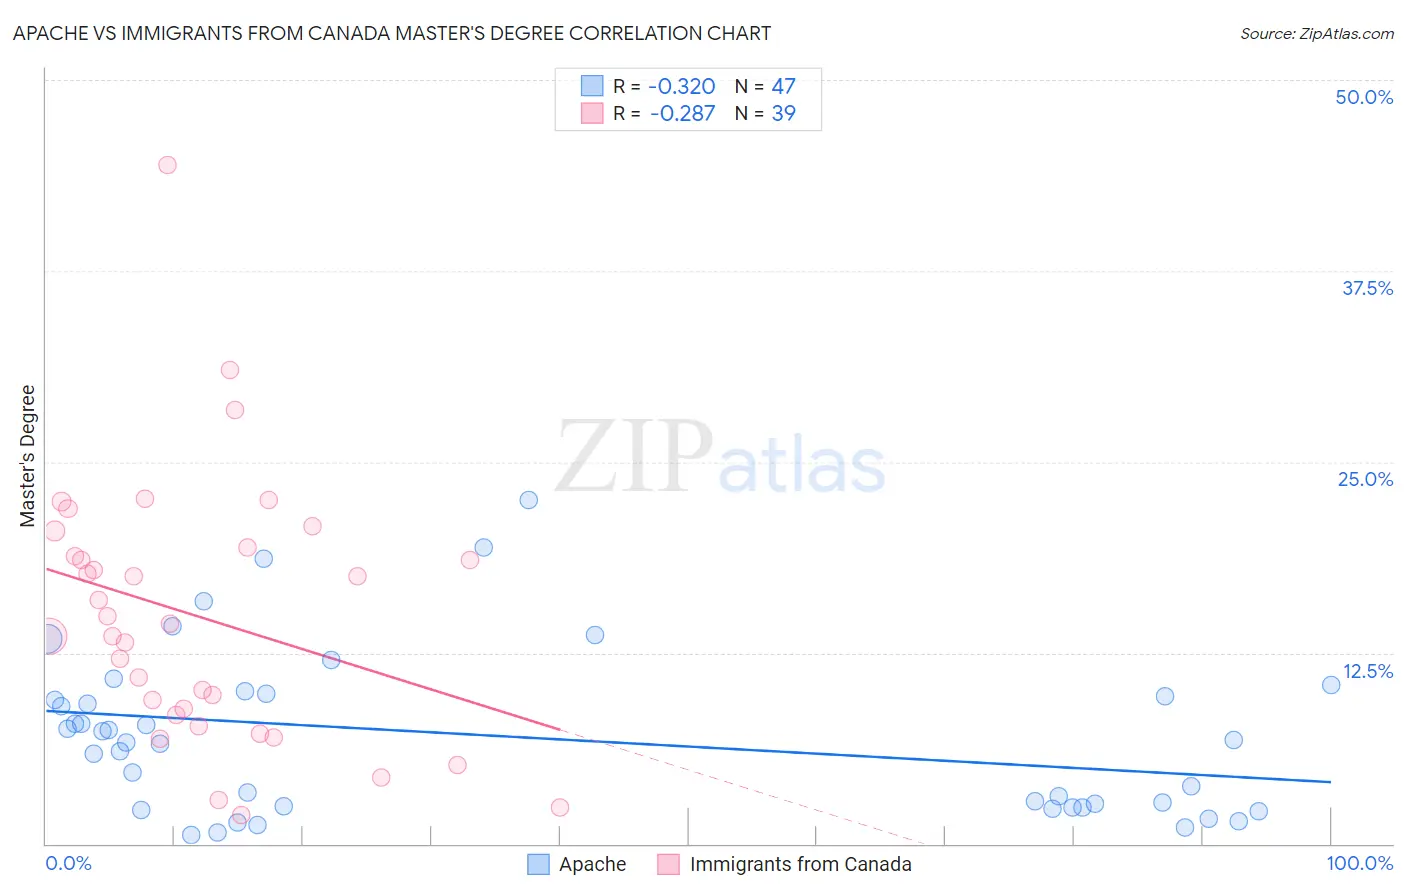
Apache vs Immigrants from Canada Master's Degree Correlation Chart
The statistical analysis conducted on geographies consisting of 231,057,413 people shows a mild negative correlation between the proportion of Apache and percentage of population with at least master's degree education in the United States with a correlation coefficient (R) of -0.320 and weighted average of 11.0%. Similarly, the statistical analysis conducted on geographies consisting of 459,222,681 people shows a weak negative correlation between the proportion of Immigrants from Canada and percentage of population with at least master's degree education in the United States with a correlation coefficient (R) of -0.287 and weighted average of 17.2%, a difference of 56.9%.
Master's Degree Correlation Summary
| Measurement | Apache | Immigrants from Canada |
| Minimum | 0.59% | 1.9% |
| Maximum | 22.5% | 44.5% |
| Range | 21.9% | 42.5% |
| Mean | 7.0% | 14.9% |
| Median | 6.7% | 14.4% |
| Interquartile 25% (IQ1) | 2.3% | 8.4% |
| Interquartile 75% (IQ3) | 9.8% | 19.4% |
| Interquartile Range (IQR) | 7.4% | 11.0% |
| Standard Deviation (Sample) | 5.3% | 8.6% |
| Standard Deviation (Population) | 5.3% | 8.5% |
Similar Demographics by Master's Degree
Demographics Similar to Apache by Master's Degree
In terms of master's degree, the demographic groups most similar to Apache are Cajun (11.0%, a difference of 0.0%), Hispanic or Latino (10.9%, a difference of 0.34%), Yaqui (11.0%, a difference of 0.40%), Choctaw (11.0%, a difference of 0.58%), and Seminole (11.0%, a difference of 0.67%).
| Demographics | Rating | Rank | Master's Degree |
| Puerto Ricans | 0.0 /100 | #308 | Tragic 11.2% |
| Puget Sound Salish | 0.0 /100 | #309 | Tragic 11.1% |
| Shoshone | 0.0 /100 | #310 | Tragic 11.1% |
| Seminole | 0.0 /100 | #311 | Tragic 11.0% |
| Choctaw | 0.0 /100 | #312 | Tragic 11.0% |
| Yaqui | 0.0 /100 | #313 | Tragic 11.0% |
| Cajuns | 0.0 /100 | #314 | Tragic 11.0% |
| Apache | 0.0 /100 | #315 | Tragic 11.0% |
| Hispanics or Latinos | 0.0 /100 | #316 | Tragic 10.9% |
| Hopi | 0.0 /100 | #317 | Tragic 10.9% |
| Immigrants | Cuba | 0.0 /100 | #318 | Tragic 10.9% |
| Kiowa | 0.0 /100 | #319 | Tragic 10.8% |
| Immigrants | Micronesia | 0.0 /100 | #320 | Tragic 10.8% |
| Pennsylvania Germans | 0.0 /100 | #321 | Tragic 10.7% |
| Sioux | 0.0 /100 | #322 | Tragic 10.7% |
Demographics Similar to Immigrants from Canada by Master's Degree
In terms of master's degree, the demographic groups most similar to Immigrants from Canada are Bhutanese (17.2%, a difference of 0.070%), Immigrants from Egypt (17.2%, a difference of 0.090%), Romanian (17.2%, a difference of 0.16%), Immigrants from North America (17.2%, a difference of 0.21%), and Immigrants from Italy (17.2%, a difference of 0.27%).
| Demographics | Rating | Rank | Master's Degree |
| Immigrants | Western Asia | 99.5 /100 | #81 | Exceptional 17.5% |
| Greeks | 99.5 /100 | #82 | Exceptional 17.5% |
| Immigrants | Zimbabwe | 99.5 /100 | #83 | Exceptional 17.4% |
| Immigrants | Scotland | 99.4 /100 | #84 | Exceptional 17.4% |
| Immigrants | Brazil | 99.4 /100 | #85 | Exceptional 17.4% |
| Immigrants | Croatia | 99.3 /100 | #86 | Exceptional 17.3% |
| Maltese | 99.3 /100 | #87 | Exceptional 17.3% |
| Immigrants | Canada | 99.2 /100 | #88 | Exceptional 17.2% |
| Bhutanese | 99.1 /100 | #89 | Exceptional 17.2% |
| Immigrants | Egypt | 99.1 /100 | #90 | Exceptional 17.2% |
| Romanians | 99.1 /100 | #91 | Exceptional 17.2% |
| Immigrants | North America | 99.1 /100 | #92 | Exceptional 17.2% |
| Immigrants | Italy | 99.1 /100 | #93 | Exceptional 17.2% |
| Ugandans | 99.0 /100 | #94 | Exceptional 17.1% |
| Immigrants | Morocco | 98.9 /100 | #95 | Exceptional 17.1% |