Immigrants from Kenya vs Cherokee 11th Grade
COMPARE
Immigrants from Kenya
Cherokee
11th Grade
11th Grade Comparison
Immigrants from Kenya
Cherokee
92.8%
11TH GRADE
78.7/ 100
METRIC RATING
147th/ 347
METRIC RANK
92.4%
11TH GRADE
40.7/ 100
METRIC RATING
181st/ 347
METRIC RANK
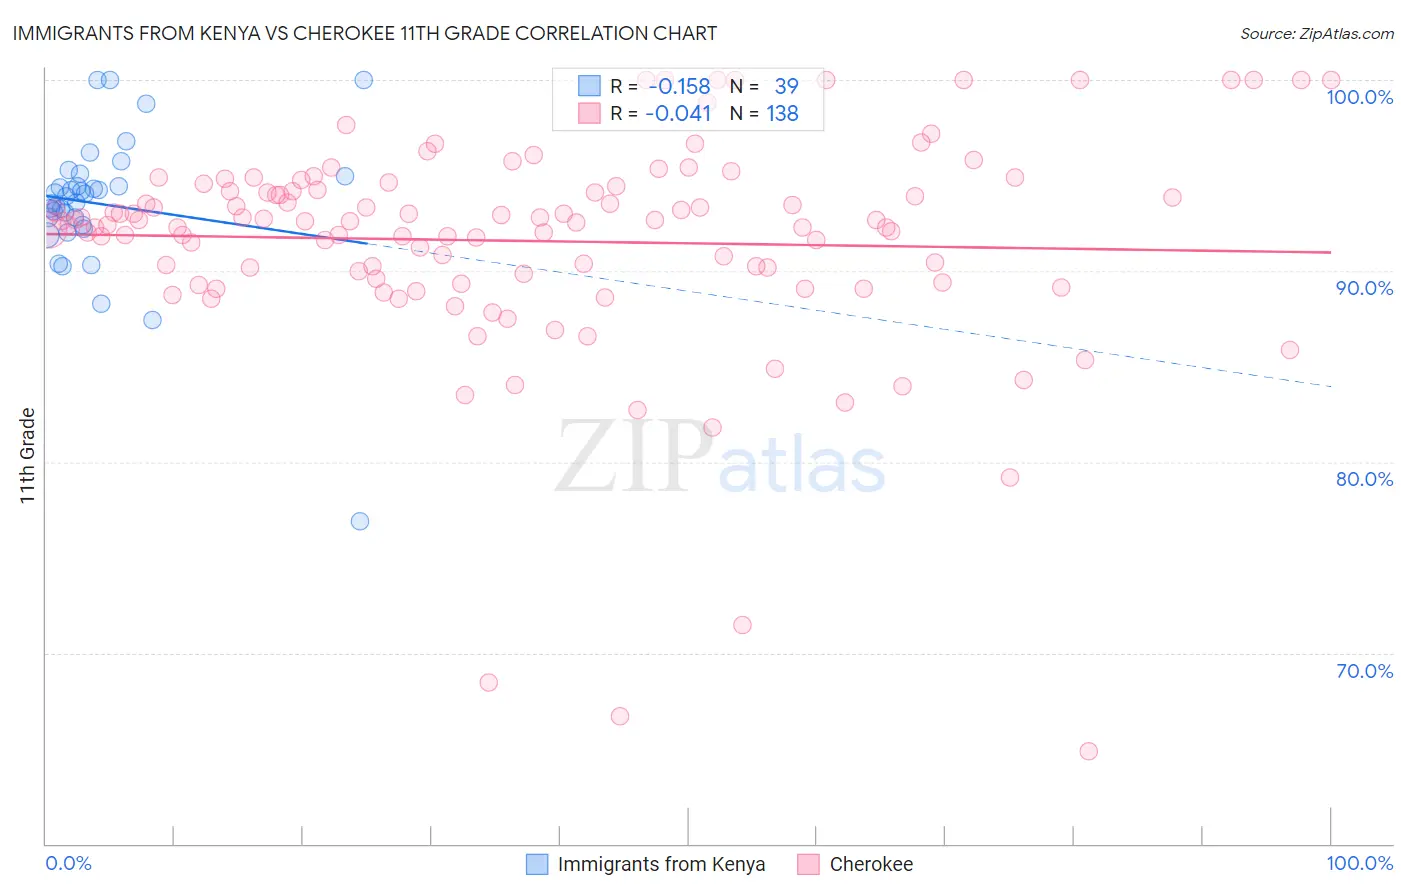
Immigrants from Kenya vs Cherokee 11th Grade Correlation Chart
The statistical analysis conducted on geographies consisting of 218,076,690 people shows a poor negative correlation between the proportion of Immigrants from Kenya and percentage of population with at least 11th grade education in the United States with a correlation coefficient (R) of -0.158 and weighted average of 92.8%. Similarly, the statistical analysis conducted on geographies consisting of 493,720,047 people shows no correlation between the proportion of Cherokee and percentage of population with at least 11th grade education in the United States with a correlation coefficient (R) of -0.041 and weighted average of 92.4%, a difference of 0.41%.
11th Grade Correlation Summary
| Measurement | Immigrants from Kenya | Cherokee |
| Minimum | 76.9% | 64.9% |
| Maximum | 100.0% | 100.0% |
| Range | 23.1% | 35.1% |
| Mean | 93.5% | 91.6% |
| Median | 93.9% | 92.6% |
| Interquartile 25% (IQ1) | 92.4% | 89.6% |
| Interquartile 75% (IQ3) | 95.0% | 94.2% |
| Interquartile Range (IQR) | 2.6% | 4.6% |
| Standard Deviation (Sample) | 3.9% | 5.8% |
| Standard Deviation (Population) | 3.8% | 5.8% |
Similar Demographics by 11th Grade
Demographics Similar to Immigrants from Kenya by 11th Grade
In terms of 11th grade, the demographic groups most similar to Immigrants from Kenya are Hmong (92.8%, a difference of 0.0%), Immigrants from Poland (92.8%, a difference of 0.0%), Pakistani (92.8%, a difference of 0.010%), Iroquois (92.8%, a difference of 0.010%), and Immigrants from Egypt (92.8%, a difference of 0.020%).
| Demographics | Rating | Rank | 11th Grade |
| Venezuelans | 83.4 /100 | #140 | Excellent 92.9% |
| Chileans | 83.0 /100 | #141 | Excellent 92.9% |
| Kenyans | 82.0 /100 | #142 | Excellent 92.9% |
| Ugandans | 81.4 /100 | #143 | Excellent 92.9% |
| Assyrians/Chaldeans/Syriacs | 80.5 /100 | #144 | Excellent 92.8% |
| Pakistanis | 79.6 /100 | #145 | Good 92.8% |
| Iroquois | 79.1 /100 | #146 | Good 92.8% |
| Immigrants | Kenya | 78.7 /100 | #147 | Good 92.8% |
| Hmong | 78.6 /100 | #148 | Good 92.8% |
| Immigrants | Poland | 78.5 /100 | #149 | Good 92.8% |
| Immigrants | Egypt | 77.5 /100 | #150 | Good 92.8% |
| Potawatomi | 74.3 /100 | #151 | Good 92.8% |
| Iraqis | 74.2 /100 | #152 | Good 92.8% |
| Brazilians | 73.9 /100 | #153 | Good 92.8% |
| Osage | 73.4 /100 | #154 | Good 92.7% |
Demographics Similar to Cherokee by 11th Grade
In terms of 11th grade, the demographic groups most similar to Cherokee are Creek (92.4%, a difference of 0.0%), Inupiat (92.4%, a difference of 0.0%), Immigrants from Morocco (92.4%, a difference of 0.020%), Sudanese (92.5%, a difference of 0.030%), and Immigrants from Malaysia (92.4%, a difference of 0.030%).
| Demographics | Rating | Rank | 11th Grade |
| Asians | 50.0 /100 | #174 | Average 92.5% |
| Shoshone | 48.9 /100 | #175 | Average 92.5% |
| Spaniards | 46.9 /100 | #176 | Average 92.5% |
| Guamanians/Chamorros | 45.0 /100 | #177 | Average 92.5% |
| Sudanese | 43.4 /100 | #178 | Average 92.5% |
| Creek | 40.9 /100 | #179 | Average 92.4% |
| Inupiat | 40.7 /100 | #180 | Average 92.4% |
| Cherokee | 40.7 /100 | #181 | Average 92.4% |
| Immigrants | Morocco | 38.6 /100 | #182 | Fair 92.4% |
| Immigrants | Malaysia | 37.6 /100 | #183 | Fair 92.4% |
| Immigrants | Asia | 37.4 /100 | #184 | Fair 92.4% |
| Immigrants | Nepal | 36.4 /100 | #185 | Fair 92.4% |
| Arapaho | 35.1 /100 | #186 | Fair 92.4% |
| Immigrants | Western Asia | 35.0 /100 | #187 | Fair 92.4% |
| Immigrants | Indonesia | 33.7 /100 | #188 | Fair 92.4% |