Immigrants from Haiti vs Canadian Associate's Degree
COMPARE
Immigrants from Haiti
Canadian
Associate's Degree
Associate's Degree Comparison
Immigrants from Haiti
Canadians
39.3%
ASSOCIATE'S DEGREE
0.0/ 100
METRIC RATING
290th/ 347
METRIC RANK
47.5%
ASSOCIATE'S DEGREE
79.0/ 100
METRIC RATING
145th/ 347
METRIC RANK
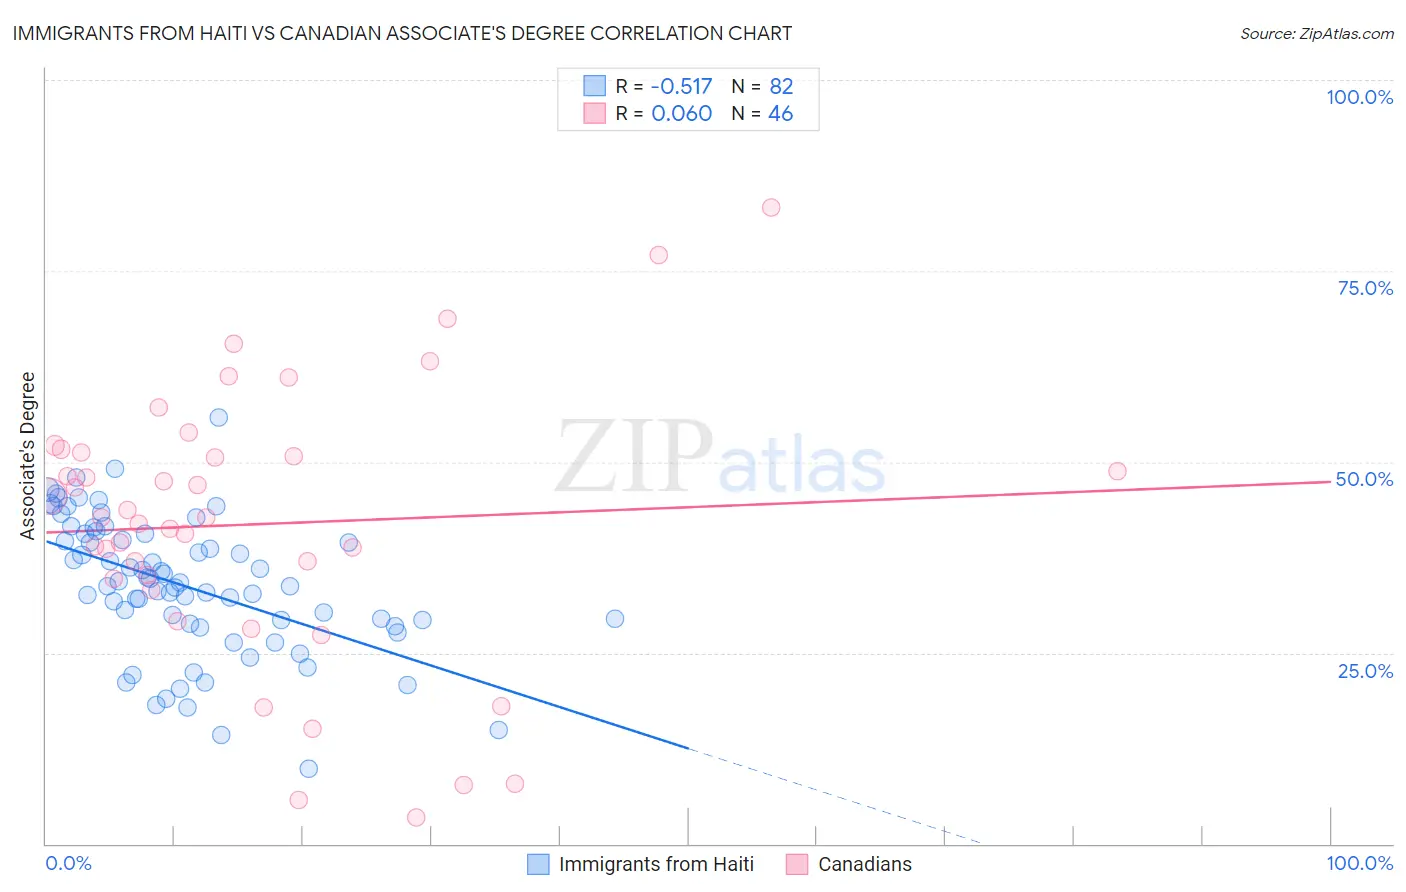
Immigrants from Haiti vs Canadian Associate's Degree Correlation Chart
The statistical analysis conducted on geographies consisting of 225,274,856 people shows a substantial negative correlation between the proportion of Immigrants from Haiti and percentage of population with at least associate's degree education in the United States with a correlation coefficient (R) of -0.517 and weighted average of 39.3%. Similarly, the statistical analysis conducted on geographies consisting of 437,535,848 people shows a slight positive correlation between the proportion of Canadians and percentage of population with at least associate's degree education in the United States with a correlation coefficient (R) of 0.060 and weighted average of 47.5%, a difference of 21.0%.
Associate's Degree Correlation Summary
| Measurement | Immigrants from Haiti | Canadian |
| Minimum | 9.8% | 3.4% |
| Maximum | 55.8% | 83.3% |
| Range | 46.0% | 80.0% |
| Mean | 33.7% | 41.8% |
| Median | 34.0% | 42.7% |
| Interquartile 25% (IQ1) | 28.8% | 34.7% |
| Interquartile 75% (IQ3) | 40.6% | 51.3% |
| Interquartile Range (IQR) | 11.7% | 16.6% |
| Standard Deviation (Sample) | 9.0% | 17.8% |
| Standard Deviation (Population) | 8.9% | 17.6% |
Similar Demographics by Associate's Degree
Demographics Similar to Immigrants from Haiti by Associate's Degree
In terms of associate's degree, the demographic groups most similar to Immigrants from Haiti are Dominican (39.3%, a difference of 0.010%), Black/African American (39.1%, a difference of 0.30%), Central American (39.4%, a difference of 0.44%), Nepalese (39.0%, a difference of 0.55%), and Salvadoran (39.0%, a difference of 0.55%).
| Demographics | Rating | Rank | Associate's Degree |
| Haitians | 0.1 /100 | #283 | Tragic 40.0% |
| Comanche | 0.1 /100 | #284 | Tragic 39.9% |
| Immigrants | Belize | 0.1 /100 | #285 | Tragic 39.9% |
| Immigrants | Caribbean | 0.0 /100 | #286 | Tragic 39.7% |
| Aleuts | 0.0 /100 | #287 | Tragic 39.6% |
| Immigrants | Cuba | 0.0 /100 | #288 | Tragic 39.5% |
| Central Americans | 0.0 /100 | #289 | Tragic 39.4% |
| Immigrants | Haiti | 0.0 /100 | #290 | Tragic 39.3% |
| Dominicans | 0.0 /100 | #291 | Tragic 39.3% |
| Blacks/African Americans | 0.0 /100 | #292 | Tragic 39.1% |
| Nepalese | 0.0 /100 | #293 | Tragic 39.0% |
| Salvadorans | 0.0 /100 | #294 | Tragic 39.0% |
| Hondurans | 0.0 /100 | #295 | Tragic 38.9% |
| Cherokee | 0.0 /100 | #296 | Tragic 38.9% |
| Cape Verdeans | 0.0 /100 | #297 | Tragic 38.8% |
Demographics Similar to Canadians by Associate's Degree
In terms of associate's degree, the demographic groups most similar to Canadians are Immigrants from Sudan (47.4%, a difference of 0.13%), Slavic (47.6%, a difference of 0.17%), Danish (47.4%, a difference of 0.18%), Norwegian (47.6%, a difference of 0.23%), and South American Indian (47.4%, a difference of 0.24%).
| Demographics | Rating | Rank | Associate's Degree |
| Poles | 87.3 /100 | #138 | Excellent 48.0% |
| Slovenes | 85.1 /100 | #139 | Excellent 47.9% |
| Immigrants | Southern Europe | 84.4 /100 | #140 | Excellent 47.8% |
| Taiwanese | 83.3 /100 | #141 | Excellent 47.7% |
| Sierra Leoneans | 82.9 /100 | #142 | Excellent 47.7% |
| Norwegians | 81.0 /100 | #143 | Excellent 47.6% |
| Slavs | 80.5 /100 | #144 | Excellent 47.6% |
| Canadians | 79.0 /100 | #145 | Good 47.5% |
| Immigrants | Sudan | 77.9 /100 | #146 | Good 47.4% |
| Danes | 77.3 /100 | #147 | Good 47.4% |
| South American Indians | 76.7 /100 | #148 | Good 47.4% |
| Immigrants | Armenia | 76.6 /100 | #149 | Good 47.4% |
| Iraqis | 76.2 /100 | #150 | Good 47.4% |
| Immigrants | North Macedonia | 76.0 /100 | #151 | Good 47.4% |
| Immigrants | Afghanistan | 74.3 /100 | #152 | Good 47.3% |