African vs Immigrants from Liberia High School Diploma
COMPARE
African
Immigrants from Liberia
High School Diploma
High School Diploma Comparison
Africans
Immigrants from Liberia
87.5%
HIGH SCHOOL DIPLOMA
0.7/ 100
METRIC RATING
256th/ 347
METRIC RANK
88.2%
HIGH SCHOOL DIPLOMA
5.5/ 100
METRIC RATING
227th/ 347
METRIC RANK
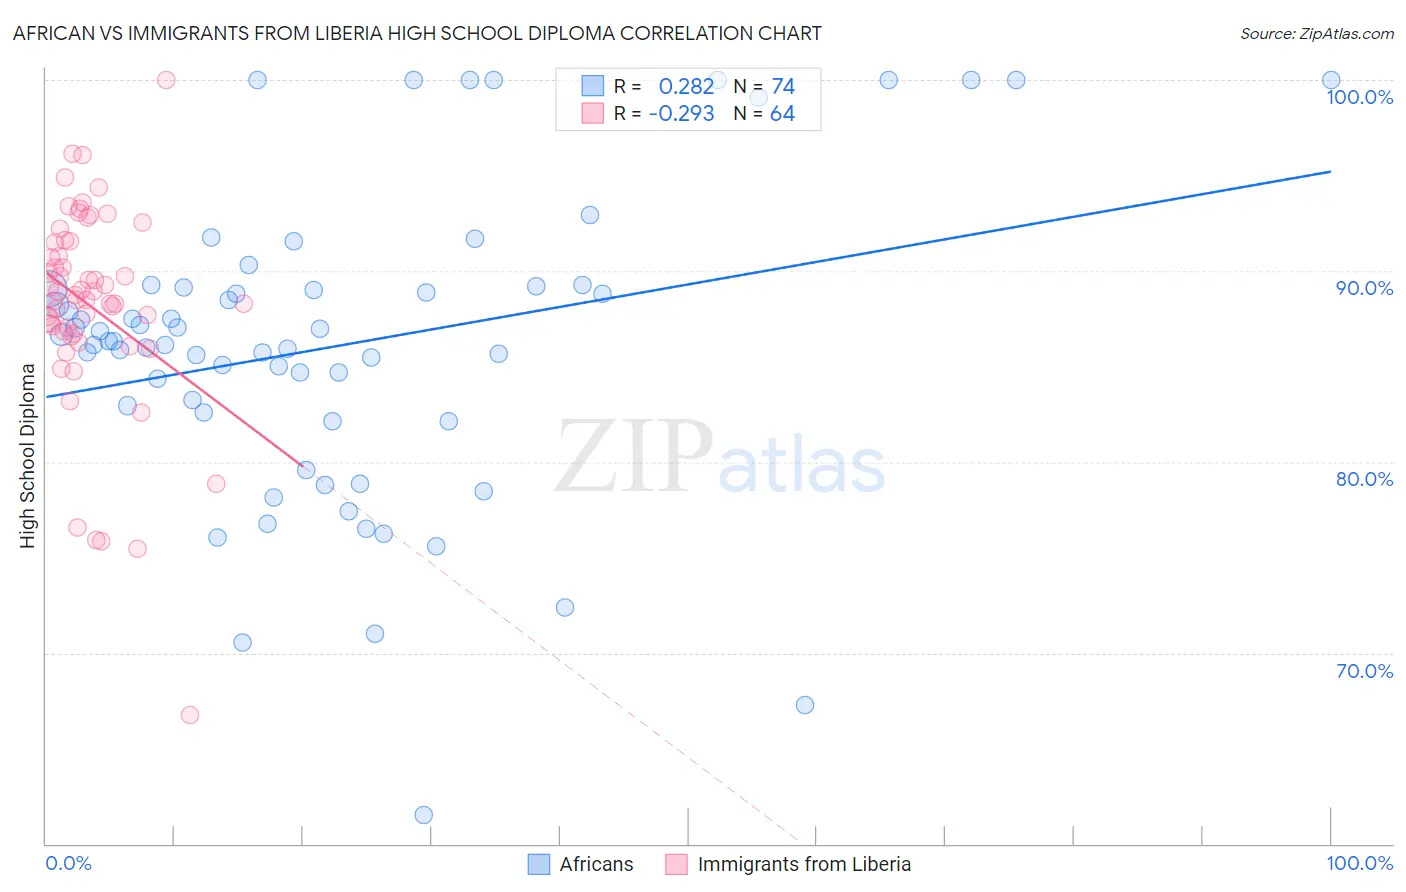
African vs Immigrants from Liberia High School Diploma Correlation Chart
The statistical analysis conducted on geographies consisting of 470,094,658 people shows a weak positive correlation between the proportion of Africans and percentage of population with at least high school diploma education in the United States with a correlation coefficient (R) of 0.282 and weighted average of 87.5%. Similarly, the statistical analysis conducted on geographies consisting of 135,293,967 people shows a weak negative correlation between the proportion of Immigrants from Liberia and percentage of population with at least high school diploma education in the United States with a correlation coefficient (R) of -0.293 and weighted average of 88.2%, a difference of 0.82%.
High School Diploma Correlation Summary
| Measurement | African | Immigrants from Liberia |
| Minimum | 61.5% | 66.8% |
| Maximum | 100.0% | 100.0% |
| Range | 38.5% | 33.2% |
| Mean | 86.1% | 88.2% |
| Median | 86.3% | 88.6% |
| Interquartile 25% (IQ1) | 82.6% | 86.8% |
| Interquartile 75% (IQ3) | 89.1% | 91.5% |
| Interquartile Range (IQR) | 6.5% | 4.7% |
| Standard Deviation (Sample) | 8.0% | 5.5% |
| Standard Deviation (Population) | 8.0% | 5.4% |
Similar Demographics by High School Diploma
Demographics Similar to Africans by High School Diploma
In terms of high school diploma, the demographic groups most similar to Africans are Bahamian (87.5%, a difference of 0.0%), Immigrants from Senegal (87.6%, a difference of 0.10%), Immigrants from Ghana (87.4%, a difference of 0.11%), Immigrants from Western Africa (87.4%, a difference of 0.12%), and Immigrants from Uruguay (87.6%, a difference of 0.16%).
| Demographics | Rating | Rank | High School Diploma |
| Senegalese | 1.5 /100 | #249 | Tragic 87.7% |
| Immigrants | Nigeria | 1.5 /100 | #250 | Tragic 87.7% |
| Ghanaians | 1.4 /100 | #251 | Tragic 87.7% |
| Immigrants | South America | 1.2 /100 | #252 | Tragic 87.6% |
| Immigrants | Uruguay | 1.0 /100 | #253 | Tragic 87.6% |
| Immigrants | Colombia | 1.0 /100 | #254 | Tragic 87.6% |
| Immigrants | Senegal | 0.9 /100 | #255 | Tragic 87.6% |
| Africans | 0.7 /100 | #256 | Tragic 87.5% |
| Bahamians | 0.7 /100 | #257 | Tragic 87.5% |
| Immigrants | Ghana | 0.5 /100 | #258 | Tragic 87.4% |
| Immigrants | Western Africa | 0.5 /100 | #259 | Tragic 87.4% |
| Cajuns | 0.4 /100 | #260 | Tragic 87.3% |
| Seminole | 0.4 /100 | #261 | Tragic 87.3% |
| Immigrants | Peru | 0.4 /100 | #262 | Tragic 87.3% |
| Immigrants | South Eastern Asia | 0.3 /100 | #263 | Tragic 87.2% |
Demographics Similar to Immigrants from Liberia by High School Diploma
In terms of high school diploma, the demographic groups most similar to Immigrants from Liberia are Uruguayan (88.2%, a difference of 0.010%), Kiowa (88.2%, a difference of 0.010%), Nigerian (88.2%, a difference of 0.020%), Creek (88.3%, a difference of 0.090%), and Shoshone (88.3%, a difference of 0.10%).
| Demographics | Rating | Rank | High School Diploma |
| Tongans | 9.5 /100 | #220 | Tragic 88.4% |
| Immigrants | Afghanistan | 8.6 /100 | #221 | Tragic 88.3% |
| Colville | 7.8 /100 | #222 | Tragic 88.3% |
| Immigrants | Zaire | 7.6 /100 | #223 | Tragic 88.3% |
| Shoshone | 7.0 /100 | #224 | Tragic 88.3% |
| Creek | 6.9 /100 | #225 | Tragic 88.3% |
| Uruguayans | 5.6 /100 | #226 | Tragic 88.2% |
| Immigrants | Liberia | 5.5 /100 | #227 | Tragic 88.2% |
| Kiowa | 5.3 /100 | #228 | Tragic 88.2% |
| Nigerians | 5.2 /100 | #229 | Tragic 88.2% |
| Blackfeet | 4.2 /100 | #230 | Tragic 88.1% |
| Colombians | 3.8 /100 | #231 | Tragic 88.1% |
| Immigrants | Middle Africa | 3.4 /100 | #232 | Tragic 88.0% |
| Immigrants | Panama | 3.1 /100 | #233 | Tragic 88.0% |
| Immigrants | Thailand | 3.1 /100 | #234 | Tragic 88.0% |