African vs Inupiat High School Diploma
COMPARE
African
Inupiat
High School Diploma
High School Diploma Comparison
Africans
Inupiat
87.5%
HIGH SCHOOL DIPLOMA
0.7/ 100
METRIC RATING
256th/ 347
METRIC RANK
88.5%
HIGH SCHOOL DIPLOMA
13.1/ 100
METRIC RATING
211th/ 347
METRIC RANK
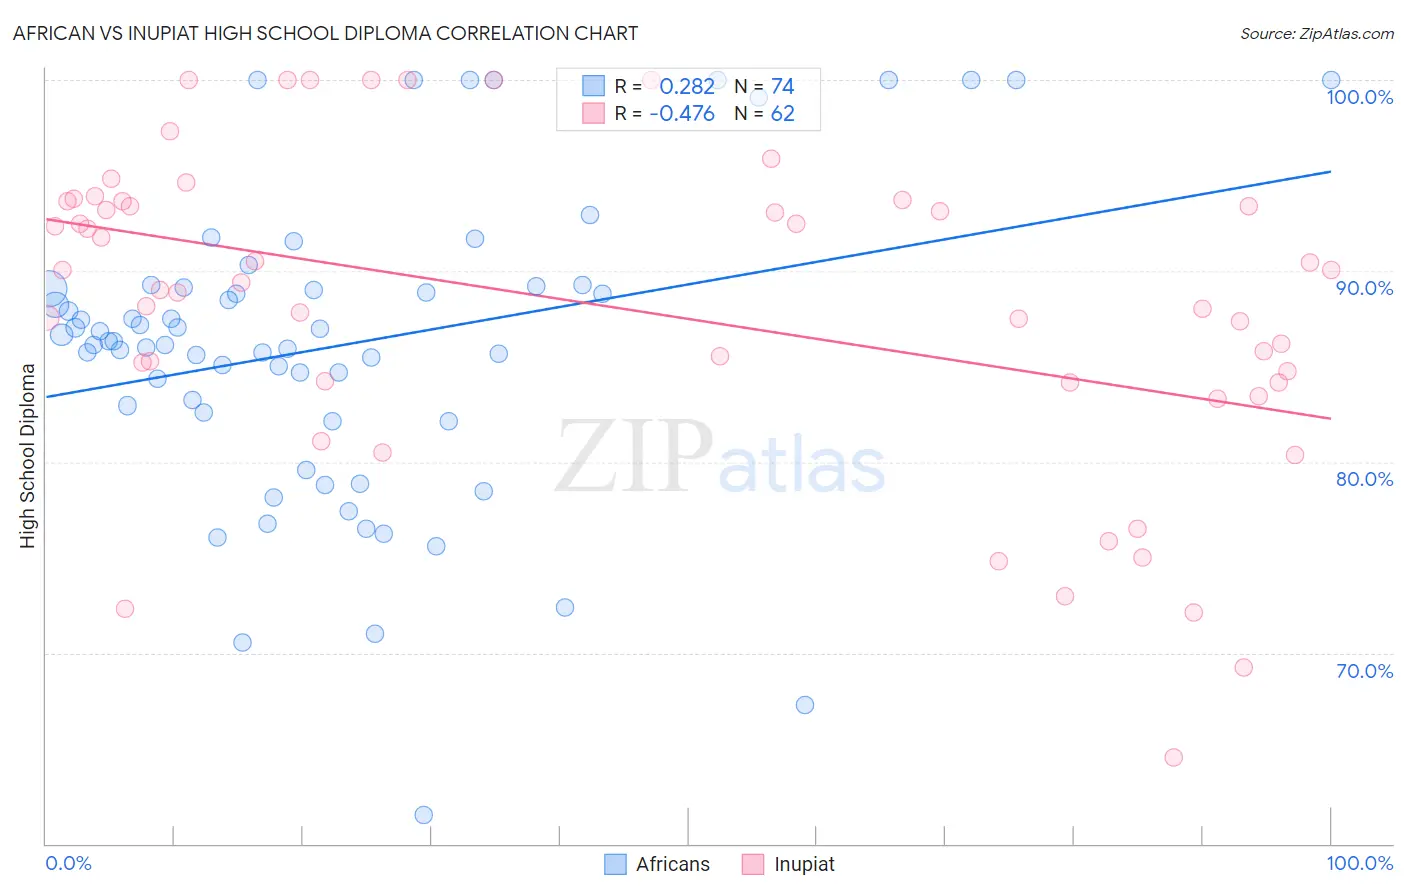
African vs Inupiat High School Diploma Correlation Chart
The statistical analysis conducted on geographies consisting of 470,094,658 people shows a weak positive correlation between the proportion of Africans and percentage of population with at least high school diploma education in the United States with a correlation coefficient (R) of 0.282 and weighted average of 87.5%. Similarly, the statistical analysis conducted on geographies consisting of 96,349,180 people shows a moderate negative correlation between the proportion of Inupiat and percentage of population with at least high school diploma education in the United States with a correlation coefficient (R) of -0.476 and weighted average of 88.5%, a difference of 1.2%.
High School Diploma Correlation Summary
| Measurement | African | Inupiat |
| Minimum | 61.5% | 64.5% |
| Maximum | 100.0% | 100.0% |
| Range | 38.5% | 35.5% |
| Mean | 86.1% | 88.1% |
| Median | 86.3% | 89.2% |
| Interquartile 25% (IQ1) | 82.6% | 84.2% |
| Interquartile 75% (IQ3) | 89.1% | 93.6% |
| Interquartile Range (IQR) | 6.5% | 9.4% |
| Standard Deviation (Sample) | 8.0% | 8.3% |
| Standard Deviation (Population) | 8.0% | 8.2% |
Similar Demographics by High School Diploma
Demographics Similar to Africans by High School Diploma
In terms of high school diploma, the demographic groups most similar to Africans are Bahamian (87.5%, a difference of 0.0%), Immigrants from Senegal (87.6%, a difference of 0.10%), Immigrants from Ghana (87.4%, a difference of 0.11%), Immigrants from Western Africa (87.4%, a difference of 0.12%), and Immigrants from Uruguay (87.6%, a difference of 0.16%).
| Demographics | Rating | Rank | High School Diploma |
| Senegalese | 1.5 /100 | #249 | Tragic 87.7% |
| Immigrants | Nigeria | 1.5 /100 | #250 | Tragic 87.7% |
| Ghanaians | 1.4 /100 | #251 | Tragic 87.7% |
| Immigrants | South America | 1.2 /100 | #252 | Tragic 87.6% |
| Immigrants | Uruguay | 1.0 /100 | #253 | Tragic 87.6% |
| Immigrants | Colombia | 1.0 /100 | #254 | Tragic 87.6% |
| Immigrants | Senegal | 0.9 /100 | #255 | Tragic 87.6% |
| Africans | 0.7 /100 | #256 | Tragic 87.5% |
| Bahamians | 0.7 /100 | #257 | Tragic 87.5% |
| Immigrants | Ghana | 0.5 /100 | #258 | Tragic 87.4% |
| Immigrants | Western Africa | 0.5 /100 | #259 | Tragic 87.4% |
| Cajuns | 0.4 /100 | #260 | Tragic 87.3% |
| Seminole | 0.4 /100 | #261 | Tragic 87.3% |
| Immigrants | Peru | 0.4 /100 | #262 | Tragic 87.3% |
| Immigrants | South Eastern Asia | 0.3 /100 | #263 | Tragic 87.2% |
Demographics Similar to Inupiat by High School Diploma
In terms of high school diploma, the demographic groups most similar to Inupiat are Samoan (88.5%, a difference of 0.030%), South American Indian (88.5%, a difference of 0.030%), Portuguese (88.5%, a difference of 0.040%), Cherokee (88.5%, a difference of 0.040%), and Immigrants from Somalia (88.4%, a difference of 0.070%).
| Demographics | Rating | Rank | High School Diploma |
| Armenians | 17.2 /100 | #204 | Poor 88.6% |
| Immigrants | Micronesia | 16.4 /100 | #205 | Poor 88.6% |
| Arapaho | 16.1 /100 | #206 | Poor 88.6% |
| Immigrants | Sierra Leone | 15.8 /100 | #207 | Poor 88.6% |
| Portuguese | 14.4 /100 | #208 | Poor 88.5% |
| Cherokee | 14.3 /100 | #209 | Poor 88.5% |
| Samoans | 14.0 /100 | #210 | Poor 88.5% |
| Inupiat | 13.1 /100 | #211 | Poor 88.5% |
| South American Indians | 12.2 /100 | #212 | Poor 88.5% |
| Immigrants | Somalia | 11.3 /100 | #213 | Poor 88.4% |
| Immigrants | Cameroon | 10.9 /100 | #214 | Poor 88.4% |
| Crow | 10.9 /100 | #215 | Poor 88.4% |
| Chickasaw | 10.7 /100 | #216 | Poor 88.4% |
| Immigrants | Africa | 10.6 /100 | #217 | Poor 88.4% |
| Immigrants | Bolivia | 10.3 /100 | #218 | Poor 88.4% |