Afghan vs U.S. Virgin Islander Master's Degree
COMPARE
Afghan
U.S. Virgin Islander
Master's Degree
Master's Degree Comparison
Afghans
U.S. Virgin Islanders
16.5%
MASTER'S DEGREE
96.2/ 100
METRIC RATING
121st/ 347
METRIC RANK
13.1%
MASTER'S DEGREE
2.1/ 100
METRIC RATING
241st/ 347
METRIC RANK
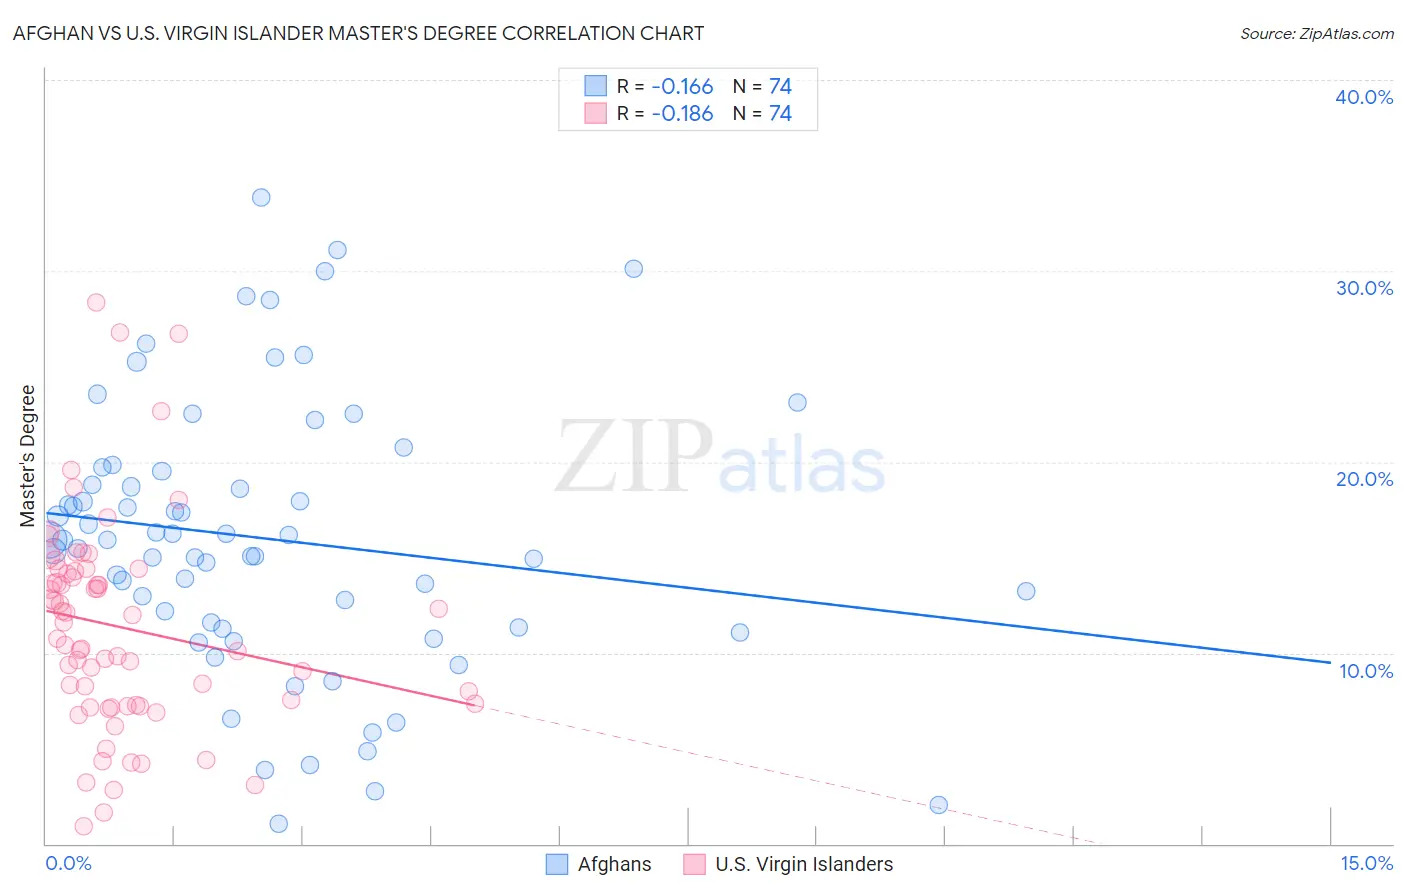
Afghan vs U.S. Virgin Islander Master's Degree Correlation Chart
The statistical analysis conducted on geographies consisting of 148,857,027 people shows a poor negative correlation between the proportion of Afghans and percentage of population with at least master's degree education in the United States with a correlation coefficient (R) of -0.166 and weighted average of 16.5%. Similarly, the statistical analysis conducted on geographies consisting of 87,520,164 people shows a poor negative correlation between the proportion of U.S. Virgin Islanders and percentage of population with at least master's degree education in the United States with a correlation coefficient (R) of -0.186 and weighted average of 13.1%, a difference of 25.8%.
Master's Degree Correlation Summary
| Measurement | Afghan | U.S. Virgin Islander |
| Minimum | 1.0% | 0.93% |
| Maximum | 33.8% | 28.3% |
| Range | 32.8% | 27.4% |
| Mean | 16.0% | 11.4% |
| Median | 15.9% | 11.2% |
| Interquartile 25% (IQ1) | 11.3% | 7.2% |
| Interquartile 75% (IQ3) | 19.5% | 14.2% |
| Interquartile Range (IQR) | 8.2% | 7.0% |
| Standard Deviation (Sample) | 7.1% | 5.5% |
| Standard Deviation (Population) | 7.1% | 5.5% |
Similar Demographics by Master's Degree
Demographics Similar to Afghans by Master's Degree
In terms of master's degree, the demographic groups most similar to Afghans are Lebanese (16.5%, a difference of 0.20%), Jordanian (16.5%, a difference of 0.30%), British (16.4%, a difference of 0.43%), Croatian (16.4%, a difference of 0.44%), and Immigrants from Eritrea (16.4%, a difference of 0.52%).
| Demographics | Rating | Rank | Master's Degree |
| Northern Europeans | 97.6 /100 | #114 | Exceptional 16.7% |
| Immigrants | Uganda | 97.3 /100 | #115 | Exceptional 16.6% |
| Immigrants | Southern Europe | 97.2 /100 | #116 | Exceptional 16.6% |
| Immigrants | Moldova | 97.2 /100 | #117 | Exceptional 16.6% |
| Brazilians | 96.8 /100 | #118 | Exceptional 16.5% |
| Jordanians | 96.5 /100 | #119 | Exceptional 16.5% |
| Lebanese | 96.4 /100 | #120 | Exceptional 16.5% |
| Afghans | 96.2 /100 | #121 | Exceptional 16.5% |
| British | 95.6 /100 | #122 | Exceptional 16.4% |
| Croatians | 95.6 /100 | #123 | Exceptional 16.4% |
| Immigrants | Eritrea | 95.5 /100 | #124 | Exceptional 16.4% |
| Italians | 95.4 /100 | #125 | Exceptional 16.4% |
| Immigrants | Eastern Africa | 95.2 /100 | #126 | Exceptional 16.3% |
| Palestinians | 94.8 /100 | #127 | Exceptional 16.3% |
| Immigrants | Sierra Leone | 94.7 /100 | #128 | Exceptional 16.3% |
Demographics Similar to U.S. Virgin Islanders by Master's Degree
In terms of master's degree, the demographic groups most similar to U.S. Virgin Islanders are Guamanian/Chamorro (13.1%, a difference of 0.14%), Spanish American (13.0%, a difference of 0.28%), Immigrants from Jamaica (13.0%, a difference of 0.32%), Delaware (13.0%, a difference of 0.70%), and Immigrants from Bahamas (12.9%, a difference of 1.4%).
| Demographics | Rating | Rank | Master's Degree |
| Immigrants | Burma/Myanmar | 5.0 /100 | #234 | Tragic 13.5% |
| German Russians | 4.5 /100 | #235 | Tragic 13.5% |
| Immigrants | Guyana | 4.4 /100 | #236 | Tragic 13.4% |
| Jamaicans | 4.1 /100 | #237 | Tragic 13.4% |
| Hmong | 4.0 /100 | #238 | Tragic 13.4% |
| Immigrants | Nonimmigrants | 3.4 /100 | #239 | Tragic 13.3% |
| Guamanians/Chamorros | 2.2 /100 | #240 | Tragic 13.1% |
| U.S. Virgin Islanders | 2.1 /100 | #241 | Tragic 13.1% |
| Spanish Americans | 1.9 /100 | #242 | Tragic 13.0% |
| Immigrants | Jamaica | 1.9 /100 | #243 | Tragic 13.0% |
| Delaware | 1.7 /100 | #244 | Tragic 13.0% |
| Immigrants | Bahamas | 1.4 /100 | #245 | Tragic 12.9% |
| Immigrants | Cambodia | 1.4 /100 | #246 | Tragic 12.9% |
| Iroquois | 1.4 /100 | #247 | Tragic 12.9% |
| Africans | 1.4 /100 | #248 | Tragic 12.9% |