Afghan vs U.S. Virgin Islander Single Father Households
COMPARE
Afghan
U.S. Virgin Islander
Single Father Households
Single Father Households Comparison
Afghans
U.S. Virgin Islanders
2.3%
SINGLE FATHER HOUSEHOLDS
50.0/ 100
METRIC RATING
174th/ 347
METRIC RANK
2.4%
SINGLE FATHER HOUSEHOLDS
31.8/ 100
METRIC RATING
189th/ 347
METRIC RANK
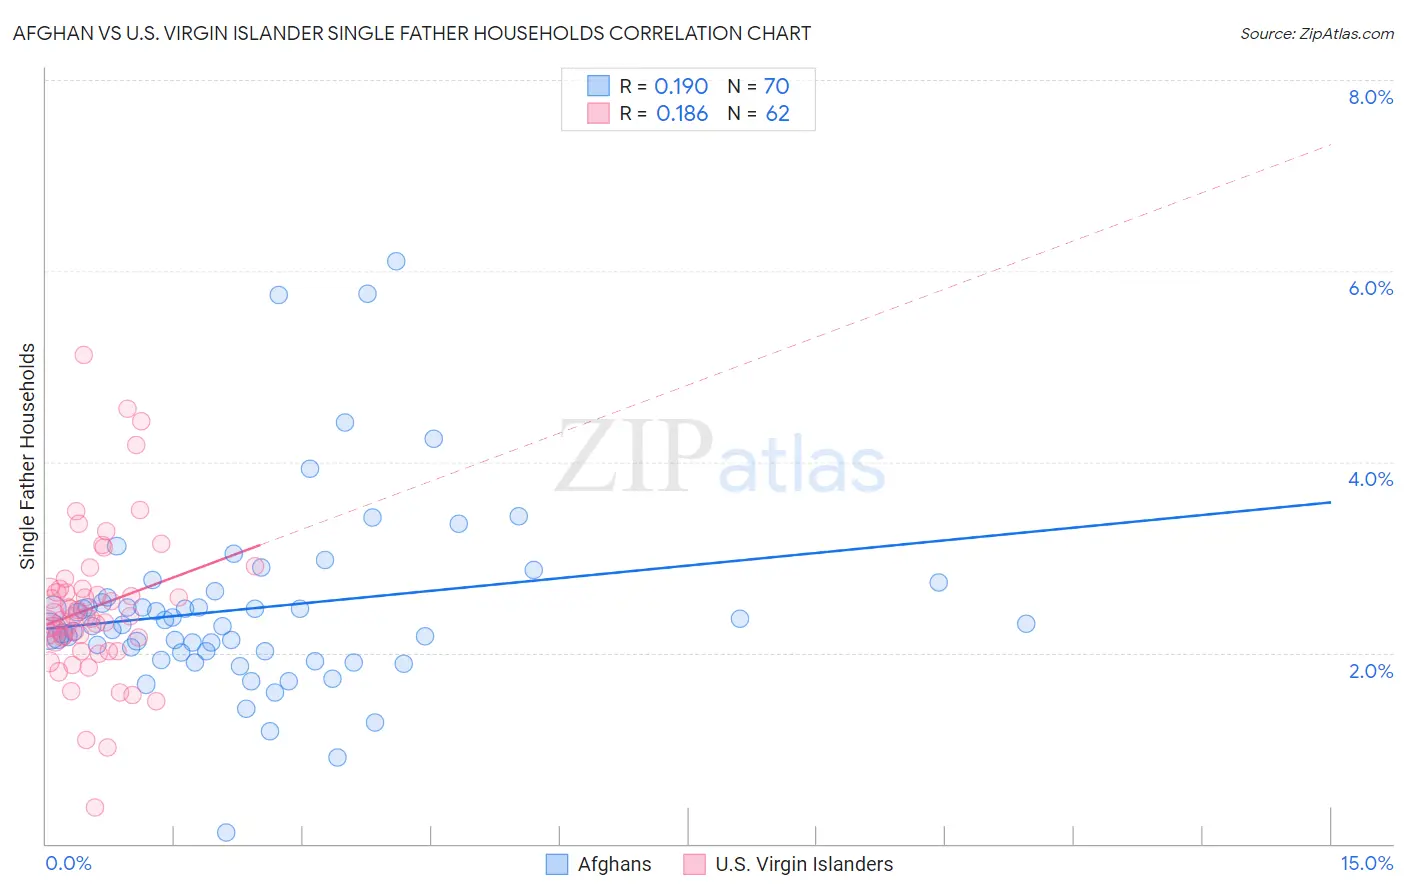
Afghan vs U.S. Virgin Islander Single Father Households Correlation Chart
The statistical analysis conducted on geographies consisting of 148,375,080 people shows a poor positive correlation between the proportion of Afghans and percentage of single father households in the United States with a correlation coefficient (R) of 0.190 and weighted average of 2.3%. Similarly, the statistical analysis conducted on geographies consisting of 87,373,145 people shows a poor positive correlation between the proportion of U.S. Virgin Islanders and percentage of single father households in the United States with a correlation coefficient (R) of 0.186 and weighted average of 2.4%, a difference of 1.4%.
Single Father Households Correlation Summary
| Measurement | Afghan | U.S. Virgin Islander |
| Minimum | 0.11% | 0.38% |
| Maximum | 6.1% | 5.1% |
| Range | 6.0% | 4.7% |
| Mean | 2.5% | 2.5% |
| Median | 2.3% | 2.4% |
| Interquartile 25% (IQ1) | 2.0% | 2.1% |
| Interquartile 75% (IQ3) | 2.6% | 2.7% |
| Interquartile Range (IQR) | 0.57% | 0.57% |
| Standard Deviation (Sample) | 0.99% | 0.80% |
| Standard Deviation (Population) | 0.98% | 0.79% |
Demographics Similar to Afghans and U.S. Virgin Islanders by Single Father Households
In terms of single father households, the demographic groups most similar to Afghans are Immigrants from Jamaica (2.3%, a difference of 0.070%), Danish (2.3%, a difference of 0.13%), Colombian (2.3%, a difference of 0.14%), Celtic (2.3%, a difference of 0.40%), and Costa Rican (2.3%, a difference of 0.44%). Similarly, the demographic groups most similar to U.S. Virgin Islanders are French (2.4%, a difference of 0.0%), Hmong (2.4%, a difference of 0.10%), Immigrants from Africa (2.4%, a difference of 0.15%), Immigrants from Colombia (2.4%, a difference of 0.18%), and Immigrants from Bosnia and Herzegovina (2.4%, a difference of 0.69%).
| Demographics | Rating | Rank | Single Father Households |
| Swedes | 61.6 /100 | #171 | Good 2.3% |
| Czechoslovakians | 58.9 /100 | #172 | Average 2.3% |
| Celtics | 55.4 /100 | #173 | Average 2.3% |
| Afghans | 50.0 /100 | #174 | Average 2.3% |
| Immigrants | Jamaica | 49.1 /100 | #175 | Average 2.3% |
| Danes | 48.2 /100 | #176 | Average 2.3% |
| Colombians | 48.0 /100 | #177 | Average 2.3% |
| Costa Ricans | 44.1 /100 | #178 | Average 2.3% |
| Welsh | 44.0 /100 | #179 | Average 2.3% |
| Yugoslavians | 43.9 /100 | #180 | Average 2.3% |
| Jamaicans | 43.5 /100 | #181 | Average 2.3% |
| Belgians | 43.3 /100 | #182 | Average 2.3% |
| Immigrants | Panama | 41.8 /100 | #183 | Average 2.4% |
| Sri Lankans | 41.8 /100 | #184 | Average 2.4% |
| Nigerians | 41.0 /100 | #185 | Average 2.4% |
| Immigrants | Bosnia and Herzegovina | 40.4 /100 | #186 | Average 2.4% |
| Immigrants | Colombia | 34.0 /100 | #187 | Fair 2.4% |
| Hmong | 33.0 /100 | #188 | Fair 2.4% |
| U.S. Virgin Islanders | 31.8 /100 | #189 | Fair 2.4% |
| French | 31.7 /100 | #190 | Fair 2.4% |
| Immigrants | Africa | 30.0 /100 | #191 | Fair 2.4% |