Immigrants from Congo vs U.S. Virgin Islander Master's Degree
COMPARE
Immigrants from Congo
U.S. Virgin Islander
Master's Degree
Master's Degree Comparison
Immigrants from Congo
U.S. Virgin Islanders
12.6%
MASTER'S DEGREE
0.8/ 100
METRIC RATING
255th/ 347
METRIC RANK
13.1%
MASTER'S DEGREE
2.1/ 100
METRIC RATING
241st/ 347
METRIC RANK
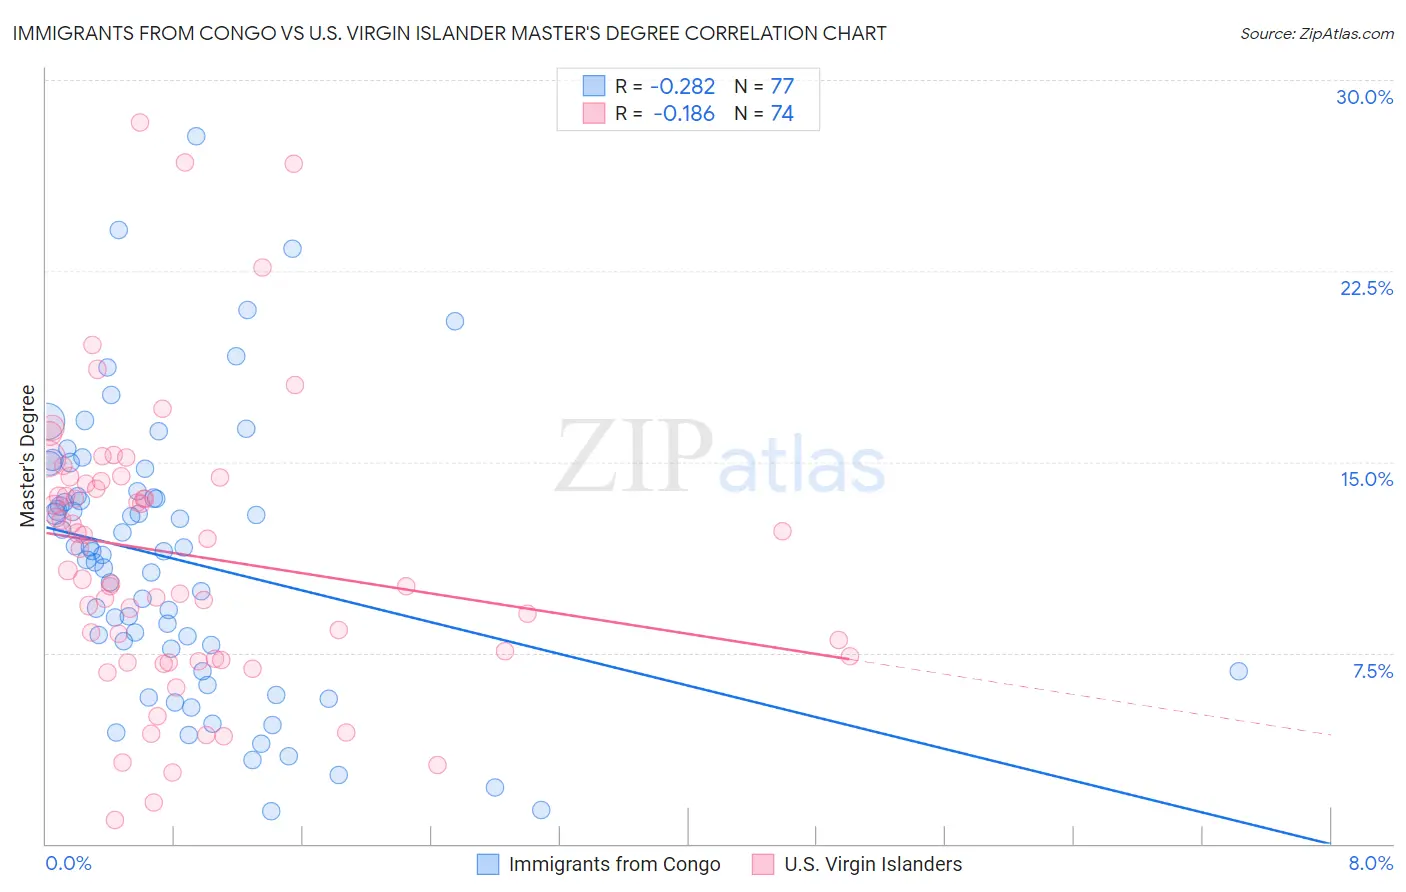
Immigrants from Congo vs U.S. Virgin Islander Master's Degree Correlation Chart
The statistical analysis conducted on geographies consisting of 92,118,005 people shows a weak negative correlation between the proportion of Immigrants from Congo and percentage of population with at least master's degree education in the United States with a correlation coefficient (R) of -0.282 and weighted average of 12.6%. Similarly, the statistical analysis conducted on geographies consisting of 87,520,164 people shows a poor negative correlation between the proportion of U.S. Virgin Islanders and percentage of population with at least master's degree education in the United States with a correlation coefficient (R) of -0.186 and weighted average of 13.1%, a difference of 3.5%.
Master's Degree Correlation Summary
| Measurement | Immigrants from Congo | U.S. Virgin Islander |
| Minimum | 1.3% | 0.93% |
| Maximum | 27.8% | 28.3% |
| Range | 26.5% | 27.4% |
| Mean | 11.1% | 11.4% |
| Median | 11.5% | 11.2% |
| Interquartile 25% (IQ1) | 7.2% | 7.2% |
| Interquartile 75% (IQ3) | 13.7% | 14.2% |
| Interquartile Range (IQR) | 6.5% | 7.0% |
| Standard Deviation (Sample) | 5.4% | 5.5% |
| Standard Deviation (Population) | 5.4% | 5.5% |
Demographics Similar to Immigrants from Congo and U.S. Virgin Islanders by Master's Degree
In terms of master's degree, the demographic groups most similar to Immigrants from Congo are Indonesian (12.6%, a difference of 0.030%), Immigrants from Dominica (12.6%, a difference of 0.070%), Immigrants from Portugal (12.6%, a difference of 0.080%), Osage (12.6%, a difference of 0.55%), and French American Indian (12.7%, a difference of 0.61%). Similarly, the demographic groups most similar to U.S. Virgin Islanders are Guamanian/Chamorro (13.1%, a difference of 0.14%), Spanish American (13.0%, a difference of 0.28%), Immigrants from Jamaica (13.0%, a difference of 0.32%), Delaware (13.0%, a difference of 0.70%), and Immigrants from Bahamas (12.9%, a difference of 1.4%).
| Demographics | Rating | Rank | Master's Degree |
| Hmong | 4.0 /100 | #238 | Tragic 13.4% |
| Immigrants | Nonimmigrants | 3.4 /100 | #239 | Tragic 13.3% |
| Guamanians/Chamorros | 2.2 /100 | #240 | Tragic 13.1% |
| U.S. Virgin Islanders | 2.1 /100 | #241 | Tragic 13.1% |
| Spanish Americans | 1.9 /100 | #242 | Tragic 13.0% |
| Immigrants | Jamaica | 1.9 /100 | #243 | Tragic 13.0% |
| Delaware | 1.7 /100 | #244 | Tragic 13.0% |
| Immigrants | Bahamas | 1.4 /100 | #245 | Tragic 12.9% |
| Immigrants | Cambodia | 1.4 /100 | #246 | Tragic 12.9% |
| Iroquois | 1.4 /100 | #247 | Tragic 12.9% |
| Africans | 1.4 /100 | #248 | Tragic 12.9% |
| Cree | 1.3 /100 | #249 | Tragic 12.8% |
| Liberians | 1.3 /100 | #250 | Tragic 12.8% |
| Tlingit-Haida | 1.3 /100 | #251 | Tragic 12.8% |
| French American Indians | 1.0 /100 | #252 | Tragic 12.7% |
| Immigrants | Dominica | 0.8 /100 | #253 | Tragic 12.6% |
| Indonesians | 0.8 /100 | #254 | Tragic 12.6% |
| Immigrants | Congo | 0.8 /100 | #255 | Tragic 12.6% |
| Immigrants | Portugal | 0.8 /100 | #256 | Tragic 12.6% |
| Osage | 0.7 /100 | #257 | Tragic 12.6% |
| Immigrants | Liberia | 0.6 /100 | #258 | Tragic 12.5% |